
Practical Malware Analysis - Chapter 10 Lab Write-up

Chapter 10. Kernel Debugging with WinDbg
Before getting into this chapter, we’ll need to setup a suitable environment for debugging Kernel Driver activity. In this instance we’ll use the below:
- VMware Player or Virtualbox
- Windows XP VM (Guest OS)
- WinDbg Preview (Host OS)
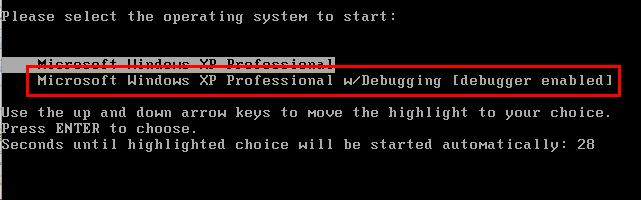
First we fire up our VM and modify boot.ini to have another entry with a COM serial port enabled (take the last line, change the name and add in the below).
/noexecute=optin /fastdetect /noexecute=optin /fastdetect /debug /debugport=COM1 /baudrate=115200
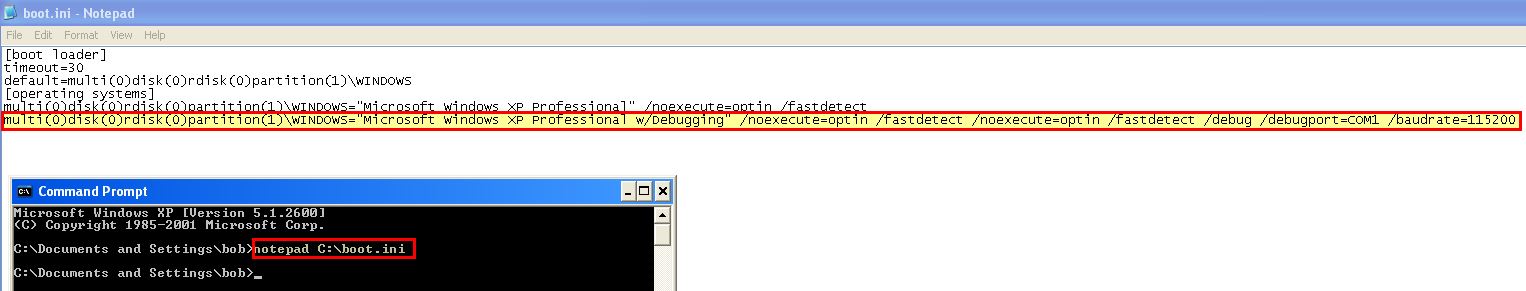
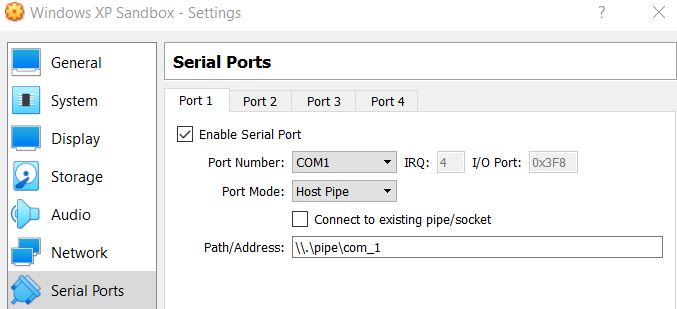
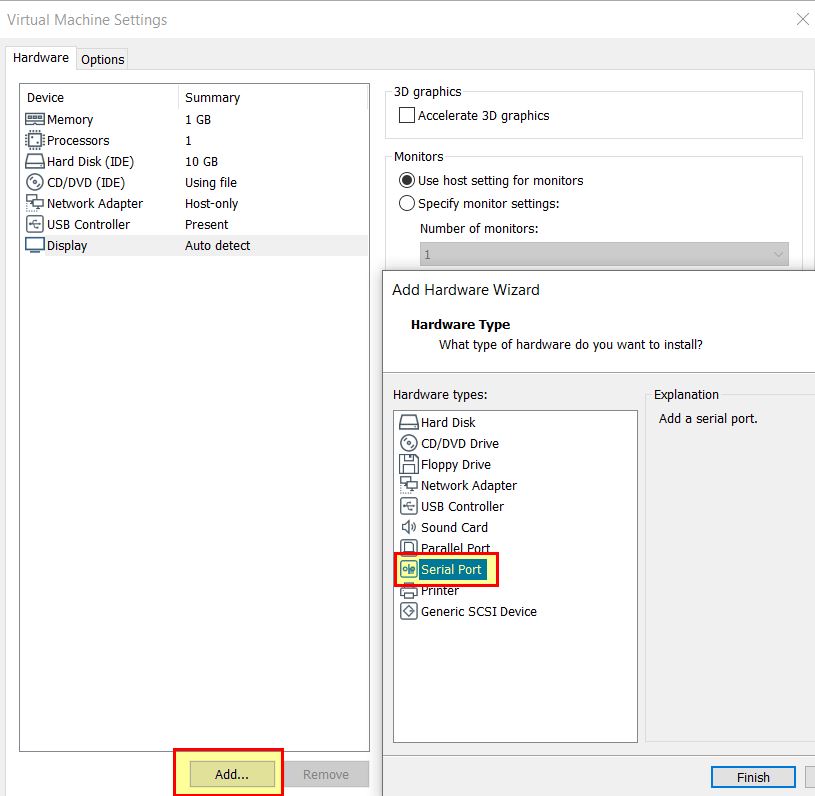
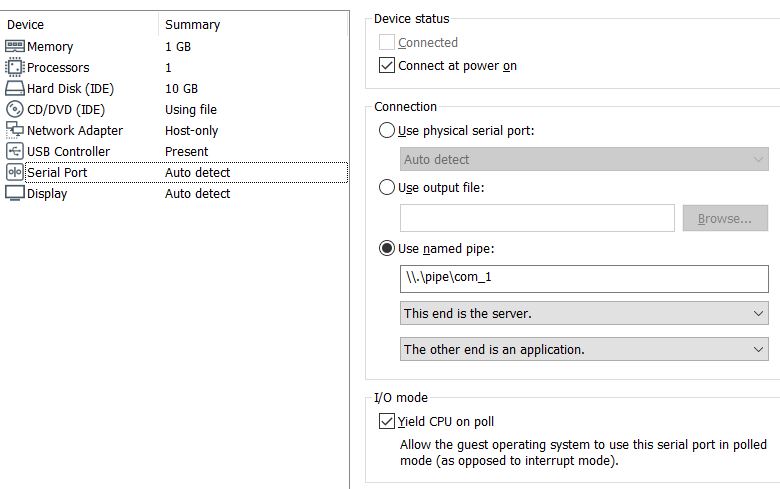
Save the file and shutdown the OS. Next create a COM serial port that uses a named pipe which our debugger will communicate with.
- Under Virtualbox this should look similar to the below:
- Under Vmware Player you will need to add a Serial Port.
- Before setting this up as a server with the other end specified as an application.
Once this is done your guest OS is ready to roll, all you need to do is open Windbg Preview and start debugging the kernel via the named pipe we created.
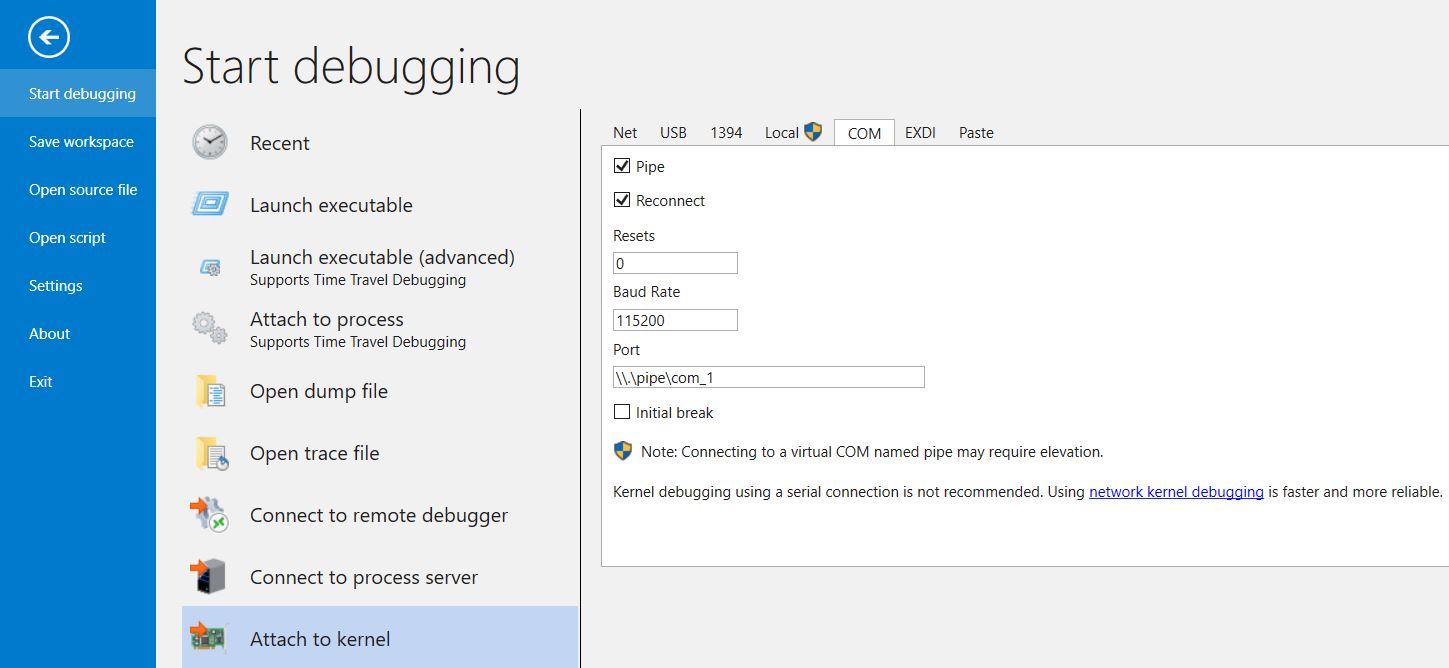
So long as our VM is booted using the COM serial port option we specified, it’ll create the named pipe that our debugger will connect to, and we’re good to go.
Useful Windbg Commands
- da = Reads from memory and displays as ascii
- du = Reads from memory and displays as unicode
- dd = Reads from memory and displays as 32-bit double values
- ex = Writes data to a memory location
- dwo = Dereference a pointer and show the value it points to e.g. ‘du dwo (esp+4)’
- bp = Create breakpoint
- g = (Go) Run an action at a breakpoint
- moduleName!symbolName = Search for symbol
- bu = Create breakpoint based on condition such as module load
- $iment = Determine entry point
- x = Search functions for value
- ln = list nearest function to memory address
- dt = Driver Type information based on symbols
- !drvobj
Common Examples:
- bu newModule!exportedFunction
- bu $iment(driverName)
- x nt!CreateProcess
- ln
Lab 10-1
This lab includes both a driver and an executable. You can run the executable from anywhere, but in order for the program to work properly, the driver must be placed in the C:\Windows\System32 directory where it was originally found on the victim computer. The executable is Lab10-01.exe, and the driver is Lab10-01.sys
Question 1
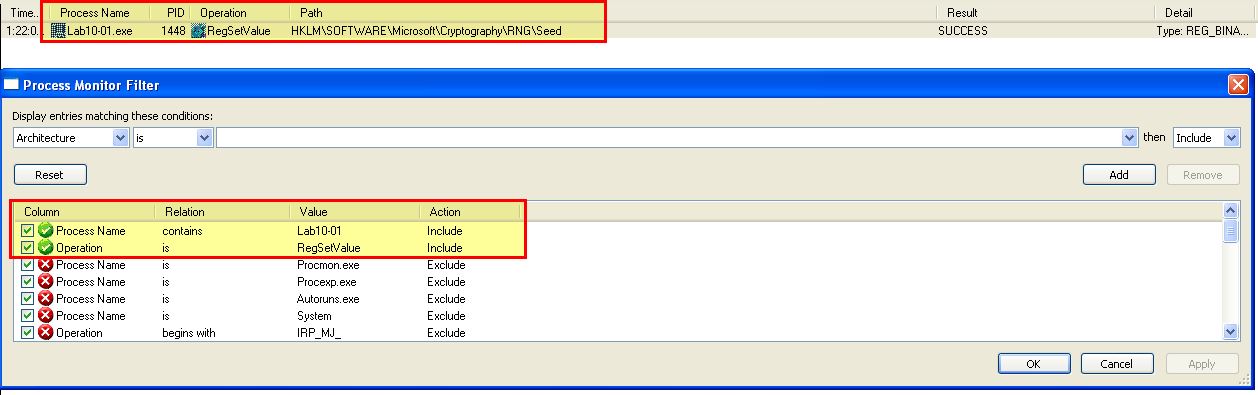
Does this program make any direct changes to the registry? (Use procmon to check.)
Answer 1
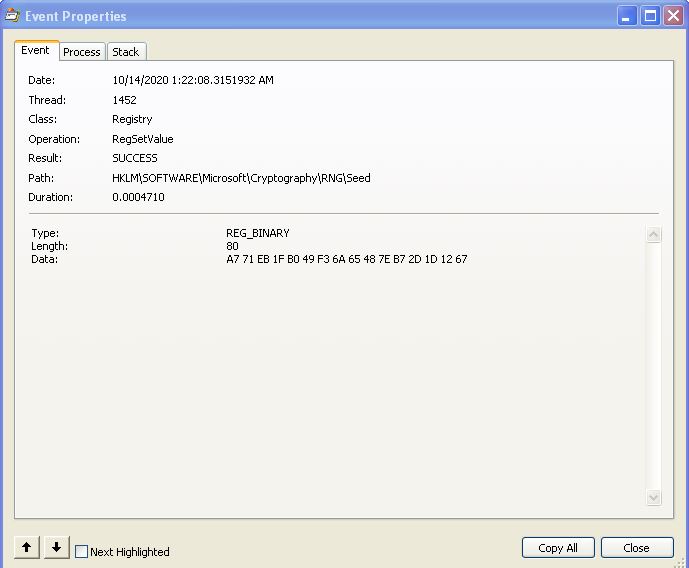
By running procmon and filtering on reg set events related to the executable lab10-01, we can see that only one direct change to the registry has been recorded: HKLM\SOFTWARE\Microsoft\Cryptography\RNG\Seed.
Question 2
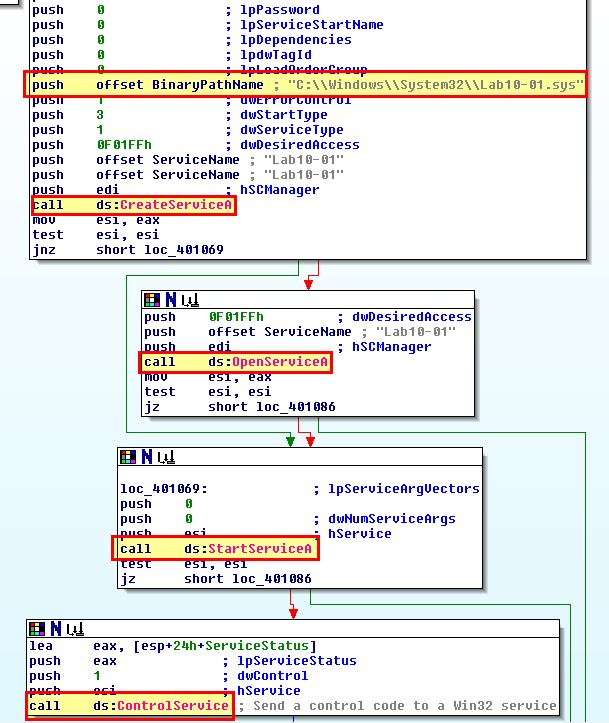
The user-space program calls the ControlService function. Can you set a breakpoint with WinDbg to see what is executed in the kernel as a result of the call to ControlService?
Answer 2
To do this we will need to setup a breakpoint using WindDbg in our VM and be analysing kernel operations using WinDbg on our host. First we need to determine where the breakpoint in our VM will be that calls the ControlService function. This can be done by examining the memory locations this occurs at in IDA.
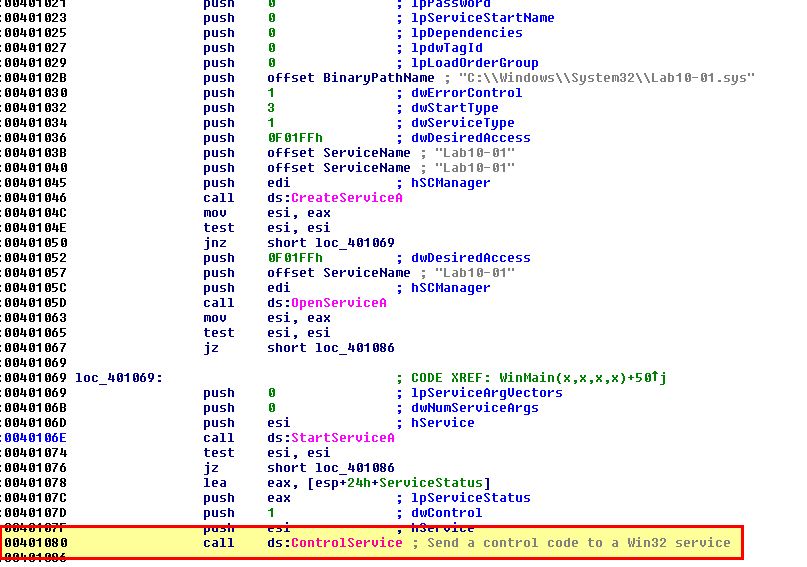
bp 0x00401080
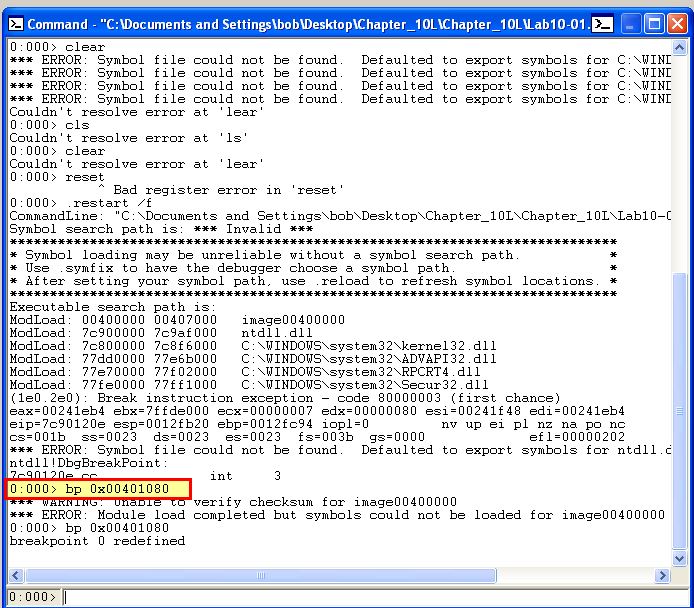
Next, while running our VM with debugging enabled and connected to our host instance of WinDbg, we open this executable in WinDbg (in our VM) and set a breakpoint at this address. This will be used to get a baseline of what has occurred prior to the call to ControlService. It’s possible you may receive an error message around verifying checksums, but attempting to run the breakpoint again ensures it is set.
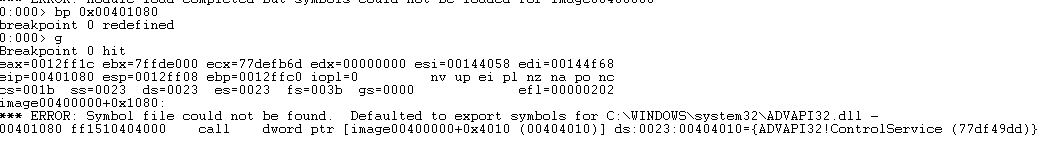
By running ‘g’ the application runs and hits our new breakpoint.
Next in our host, initiate a ‘break’. This will cause the VM to stop responding as we’ve now hit a break on the kernel running. Next we run ‘!drvobj lab10-01’ to locate the driver lab10-01.sys and see if there’s any device objects that can be interacted with from user applications.
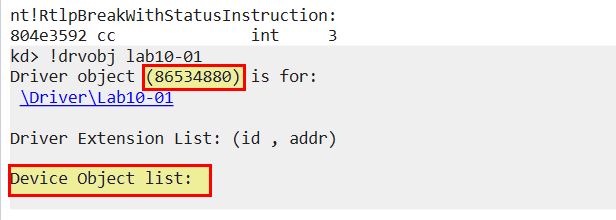
Based on this we know the address it is loaded into (0x86534880), and that it contains no user land device objects. From here we can get more information about this driver using ‘dt _DRIVER_OBJECT 86534880’
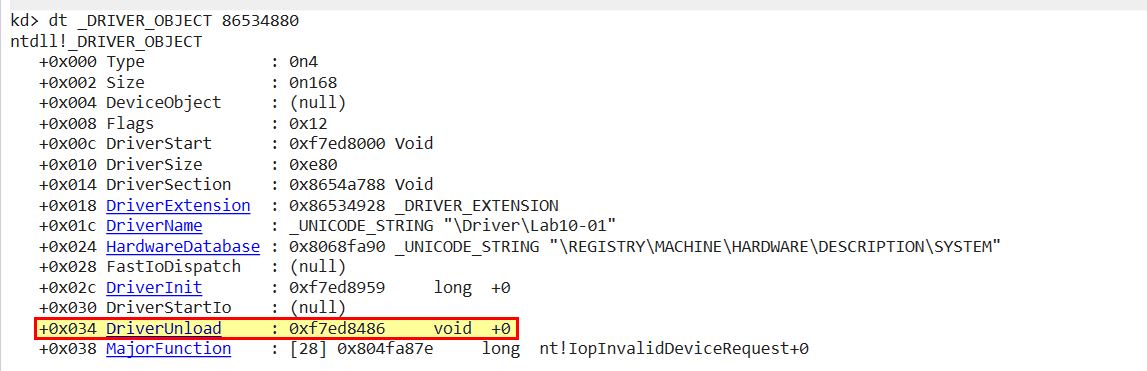
Because we want to know what has changhed before the kernel driver is unloaded, we can now set a breakpoint at this location ‘bp 0xf7ed8486’ and resume the kernel with ‘go’. At this point the OS is usable again. By clicking ‘go’ or running ‘g’ on the debugged application in our VM once again, the OS freezes and we’re notified that the kernel breakpoint has now been hit.
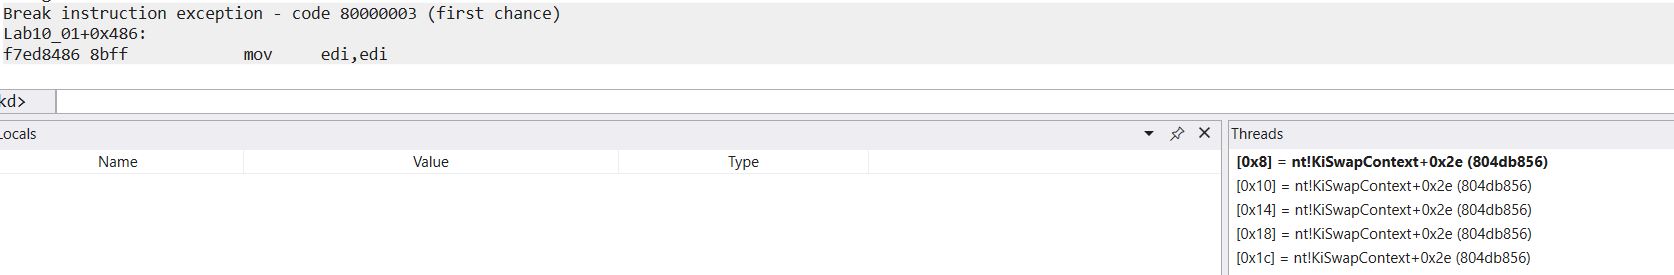
By stepping through operations, we can see that this then executes some commands to create a registry key.
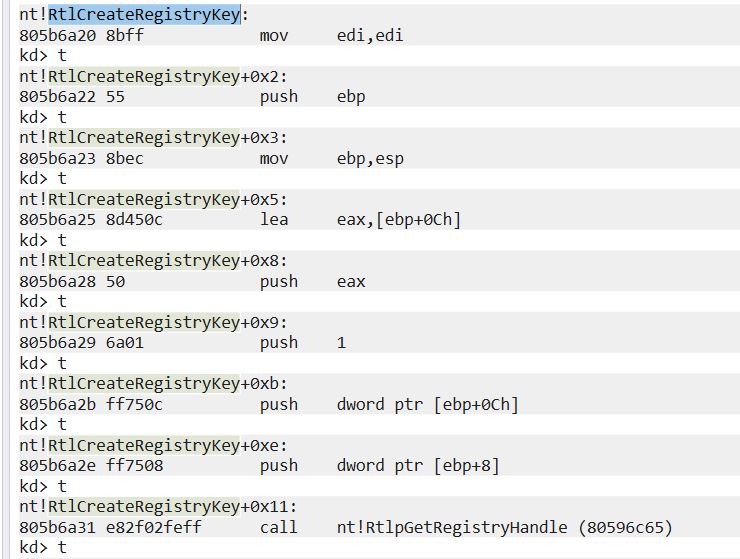
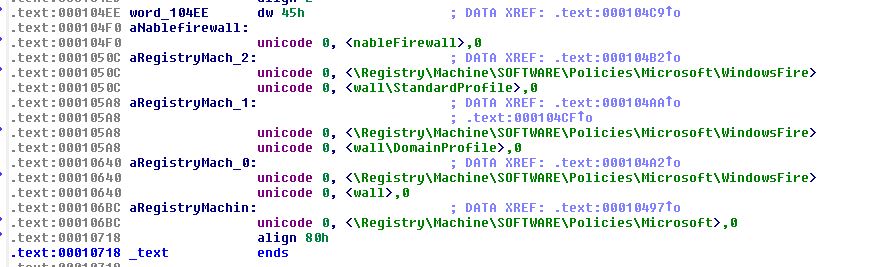
At this point it’s worth analysing the driver using IDA to gather more information on what has occurred. By looking at this location within IDA, we can easily see that it is creating 5 different registry keys which goes completely undetected by Procmon.
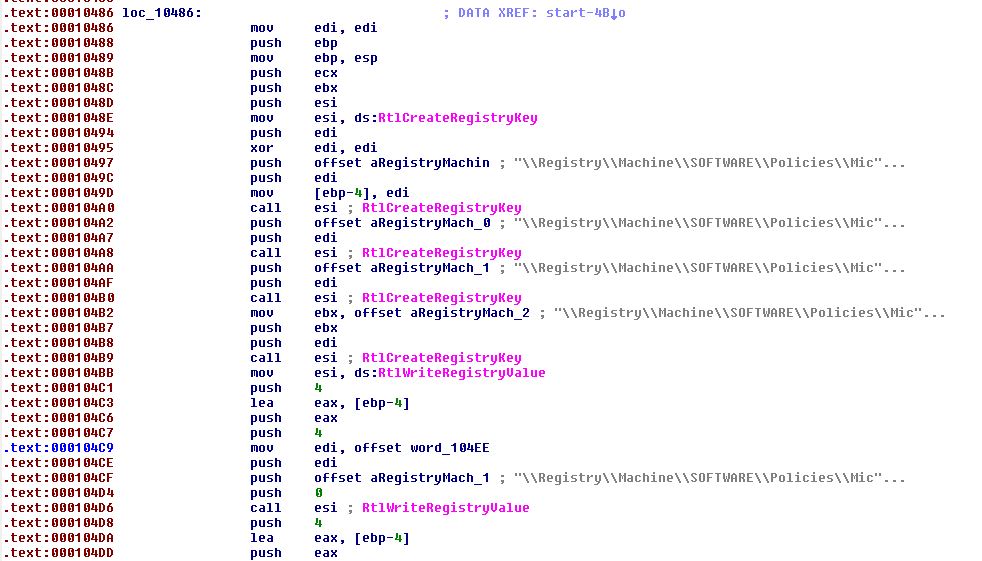
Looking closer at these values we can see that it is setting keys to disable the Windows Firewall by changing these values to 0.
Question 3
What does this program do?
Answer 3
By taking a look at what we know, we can examine the binary in question within IDA and see it creates a kernel service which is then used to stealthily update the registry to disable the Windows Firewall before being unloaded.
Lab 10-2
The file for this lab is Lab10-02.exe.
Question 1
Does this program create any files? If so, what are they?
Answer 1
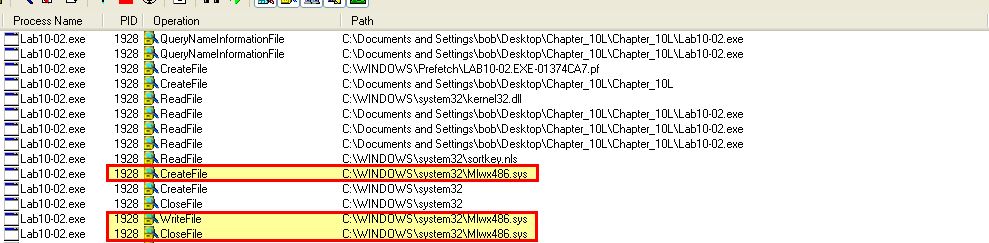
By running this program and examining it with Procmon we can see that it creates a kernel driver and writes it to disk.
- C:\Windows\System32\Mlwx486.sys
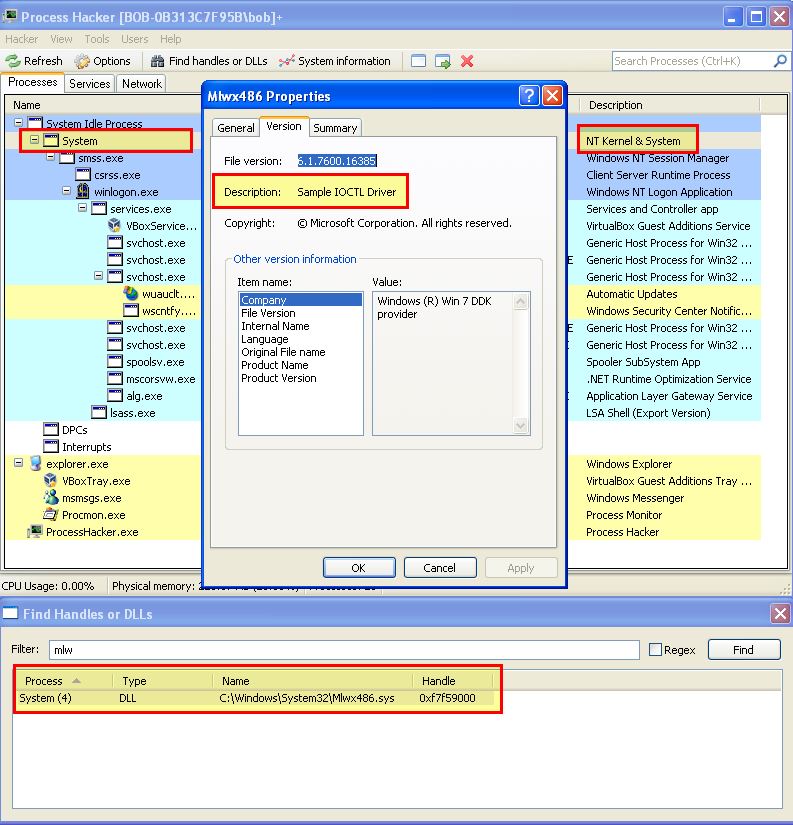
Attempting to view the file on disk causes it to not be shown; however, using process hacker we’re able to find this file loaded into the kernel and gather from its description that it’s likely an Input and Output Control driver, so we may be looking at a rootkit here.
This same information could have been found by using our previously setup kernel debugger.
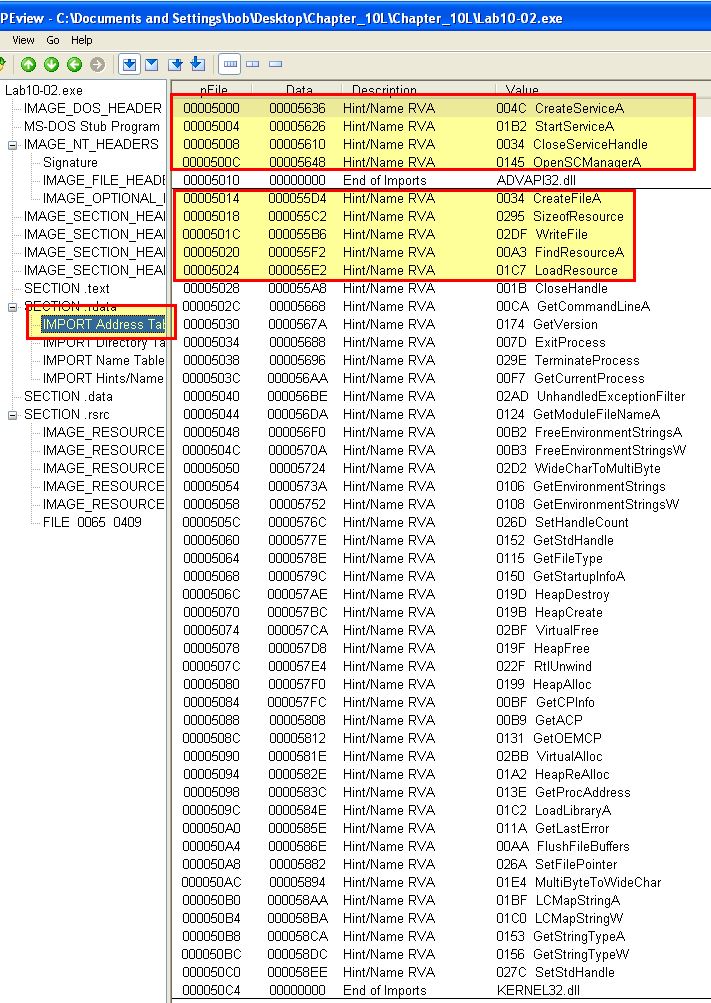
By examining the imported functions of this binary using peview, we can see that it is likely going to examine the contents of its resource section and write a file to disk. This helps to confirm what we saw with Procmon.
Question 2
Does this program have a kernel component?
Answer 2
By examining the resource section of lab10-02.exe using resource hacker we’re able to see it is indeed hiding an executable of some kind, and in this instance the Program Database (pdb) we can see (which holds debugging references), leads us once again to thinking this contains a kernel component/rootkit.
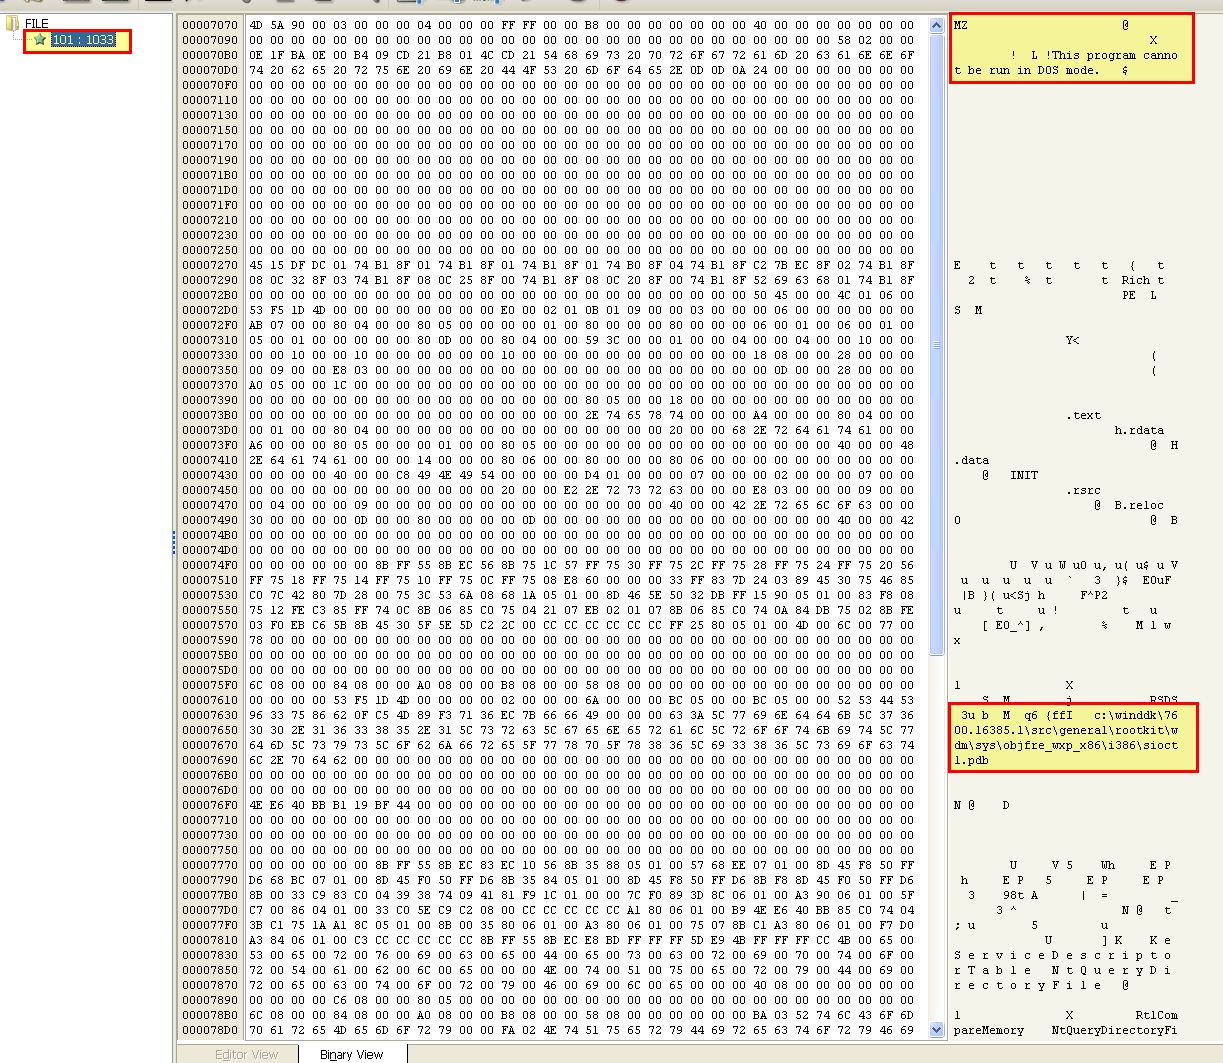
With resource hacker we can save this directly to a .sys file and have the filtering kernel component extracted with the following SHA256 hash.
42B66F4DCB1380AB6330CFB638CE97C7BEA6D772EDDD1D34C1031B0D16DEA19C
This has the same file information as the kernel driver currently loaded from: C:\Windows\System32\Mlwx486.sys.
Examining the binary through IDA (The driver we extracted with resource hacker) reveals that it is indeed creating the file and creating a service for it called ‘486 WS Driver’ before starting it.
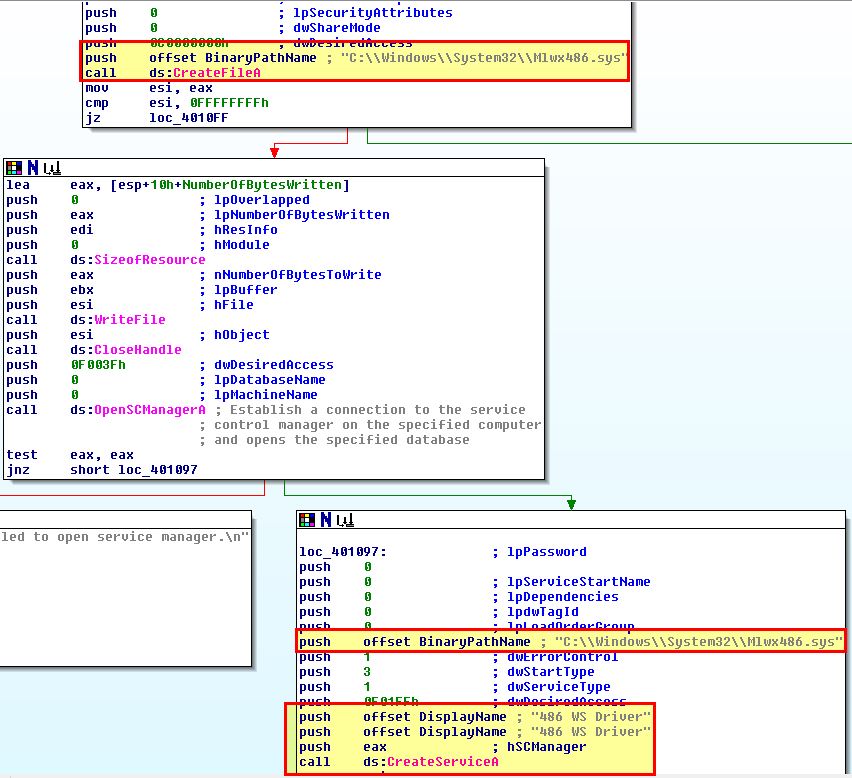
We can see this through the use of the Service Control (SC) binary.
Question 3
What does this program do?
Answer 3
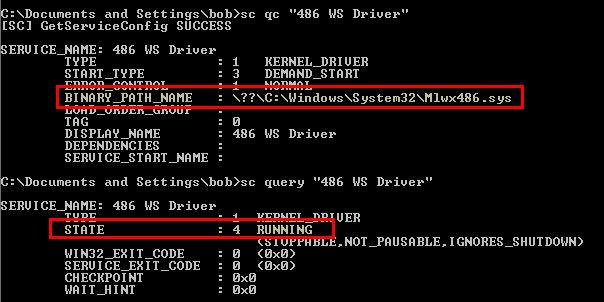
Currently we know that this creates a service with an unknown driver that can’t be seen on disk and looks like a rootkit. To get some more information we can debug the driver in memory. Upon restarting the host it’s likely that the driver won’t have started and will need to be started with the Service Control binary.
- sc start “486 WS Driver”
From here we can break into our debugger and see whether this is loaded by using ‘lm’ and clicking on our identified driver.
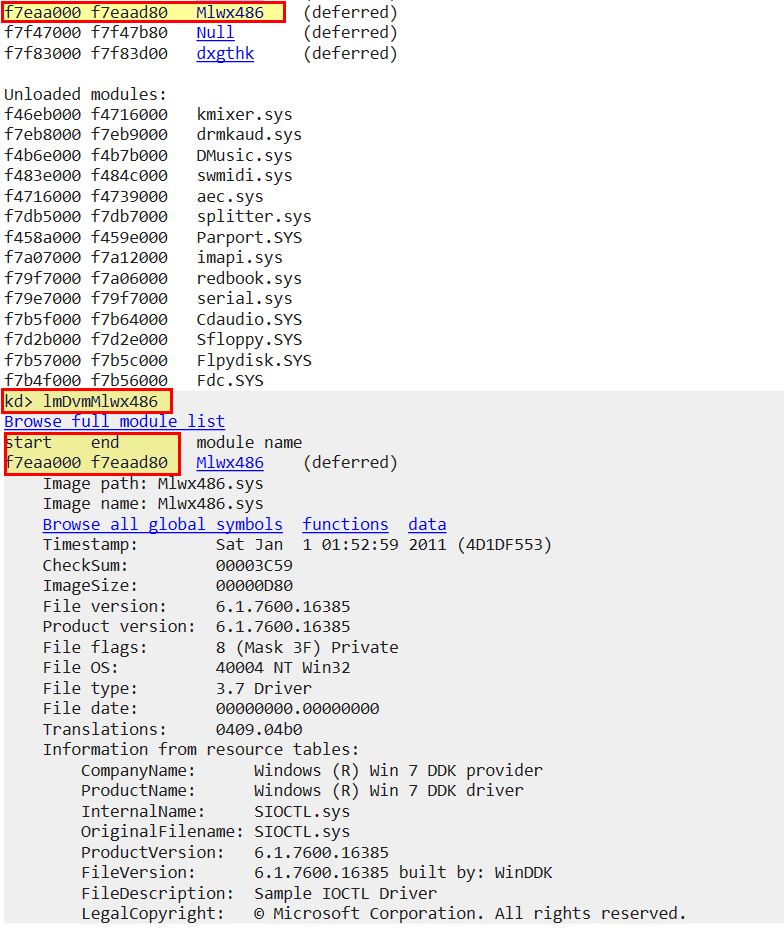
This gives us enough information to begin probing the System Service Descriptor Table (SSDT), or in layman terms, a table of pointers to addresses in memory where kernel functions are located. This is identified by ntoskrnl.exe (NT OS Kernel, this dates back to Windows NT days) as ‘KiServiceTable’.
Given we are looking for pointers and know that Debugging Symbols makes our life easier, we can use the ‘dps’ command to dump pointer symbols of the KiServiceTable, list out 100 entries and view what has been loaded into the kernel. We would expect all the memory addresses to point to a similar location in memory and be from the same module e.g. ntoskrnl.exe (NT); however, when we analyse this we can see an anomaly.
dps KiServiceTable L100
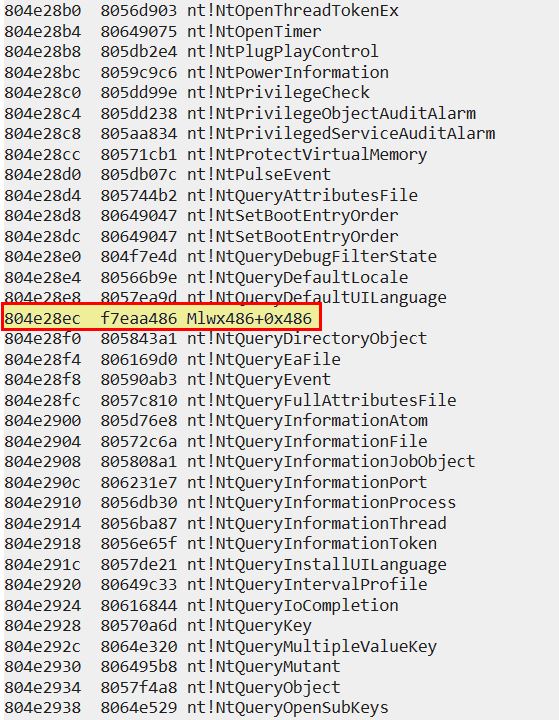
Based on this output we can see that the driver (module) has hooked an entry in KiServiceTable and pointed it to our identified malicious driver. Note: In later 64-bit versions of Windows this technique would cause a blue screen due to a security feature known as ‘patch guard’.
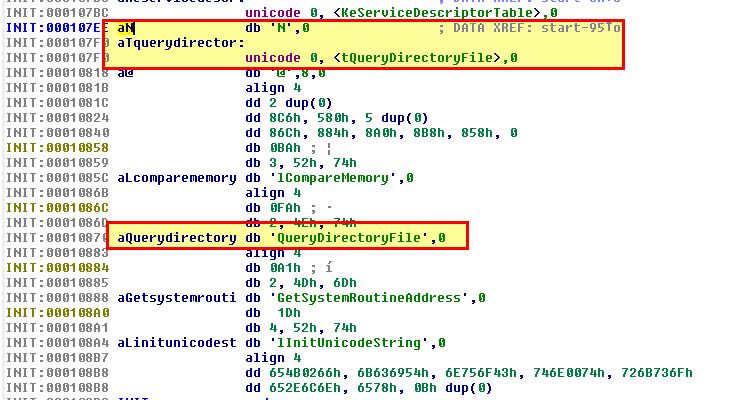
To determine what it has hooked, we can locate what was at this address prior to infection, or we can examine this more thoroughly using IDA. When looking at this through IDA we can see it seems to be hooking NtQueryDirectoryFile.
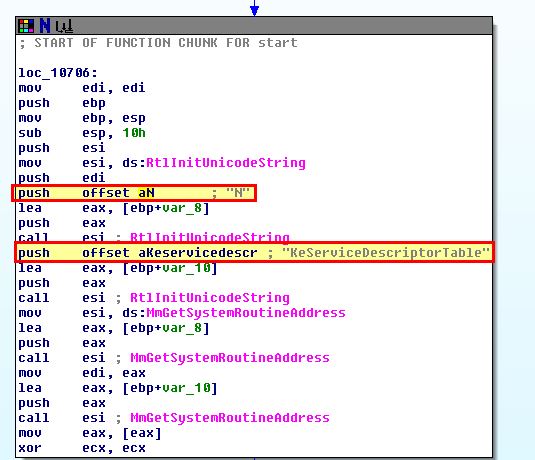
By jumping to the file offset we identified through debugging ‘0x486’, we see some information that looks like it’s part of a function.
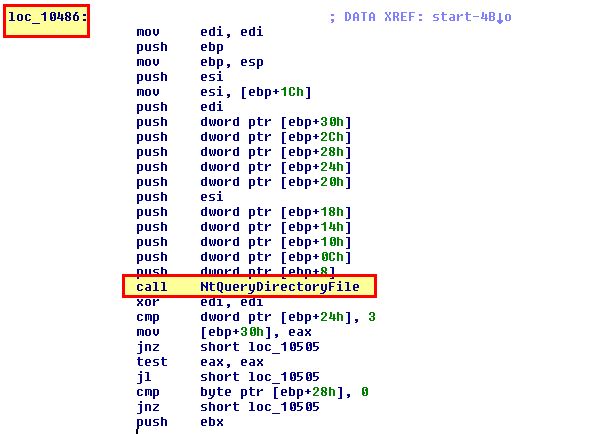
By right clicking the location and selecting ‘create function’ we can get a clearer picture of what is occurring.
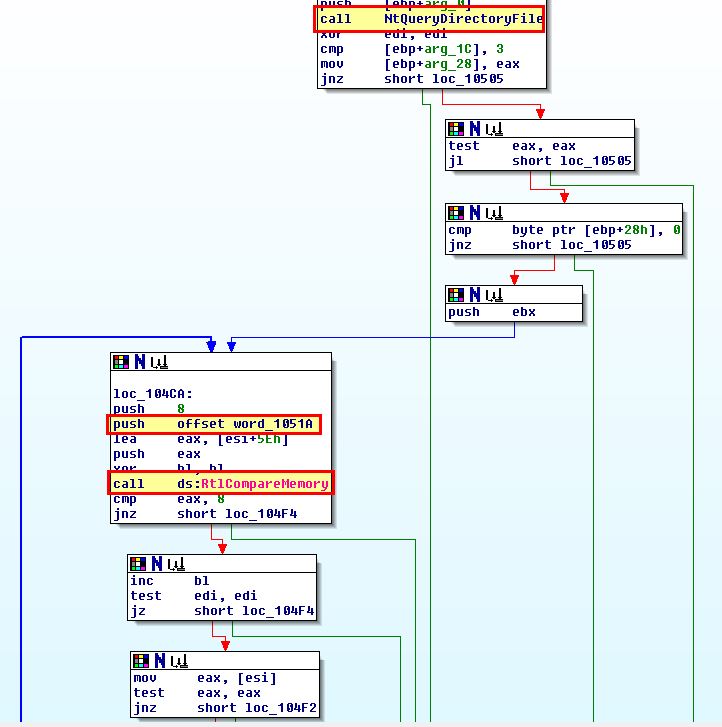
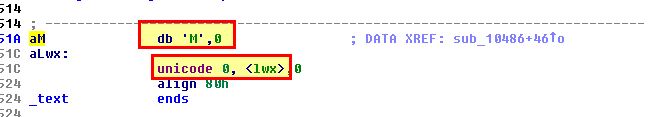
Of most interest is that after the driver calls the legitimate NtQueryDirectoryFile function, it then adds an entry to compare a value to a block of memory. If we convert this to ascii and view the entry for word_1051A, we can see it is comparing to the value ‘Mlwx’.
This makes it far more clear that the hook functions like normal; however, if a file exists with a name starting with ‘Mlwx’, it won’t be shown (as a jump occurs). We can test this by creating a folder or file beginning with this and watching it vanish before our very eyes.
At this point we have a clear understanding that this is designed to install a kernel rootkit that uses SSDT hooking to hide any files or folders beginning with (case-sensitive) ‘Mlwx’.
Lab 10-3
This lab includes a driver and an executable. You can run the executable from anywhere, but in order for the program to work properly, the driver must be placed in the C:\Windows\System32 directory where it was originally found on the victim computer. The executable is Lab10-03.exe, and the driver is Lab10-03.sys.
Question 1
What does this program do?
Answer 1
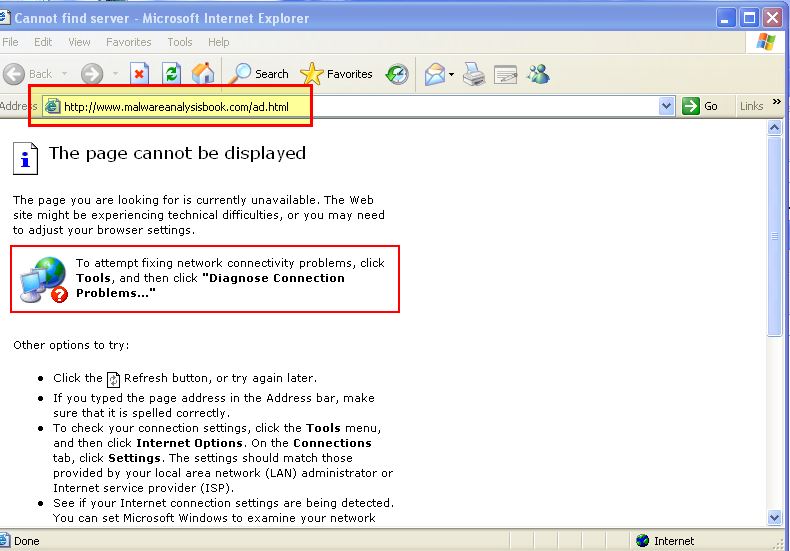
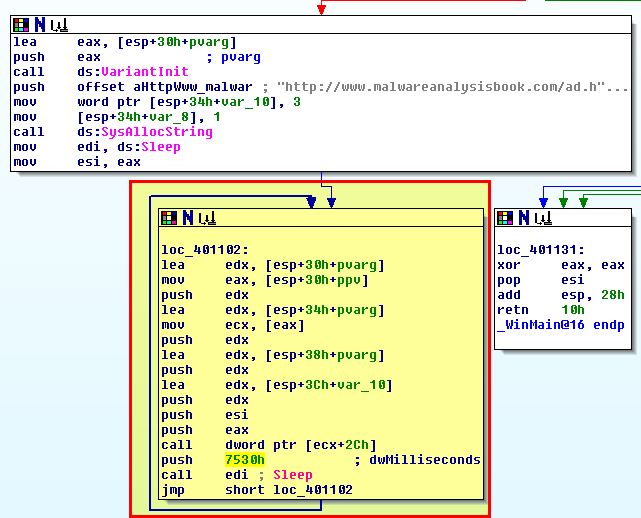
By running the program in a sandbox we can see that after a brief period of time it opens a web browser to an advertisement located at: http://malwareanalysisbook.com/ad.html. This continues to open a new web browser pointing at this webpage at regular intervals.
By analysing the accompanying windows driver with peview (Lab10-03.sys) we can see that it has a number of imports including ‘IoGetCurrentProcess’.
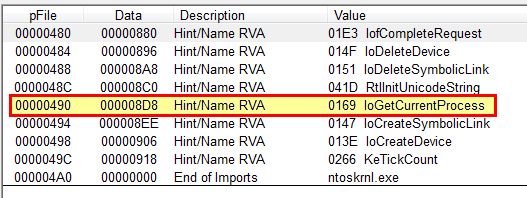
The other imports are common among drivers; however, this particular import gives us the impression that the driver will be getting a pointer to the current process it is running from, and in essence will be either getting information about it or modifying it.
To get more information on what is occurring we can look at the executable Lab10-03.exe through IDA. At a glance we can see that this is creating a service called “Process Helper” which points to the aforementioned driver, before starting it and getting a handle to \.\ProcHelper through CreateFileA.
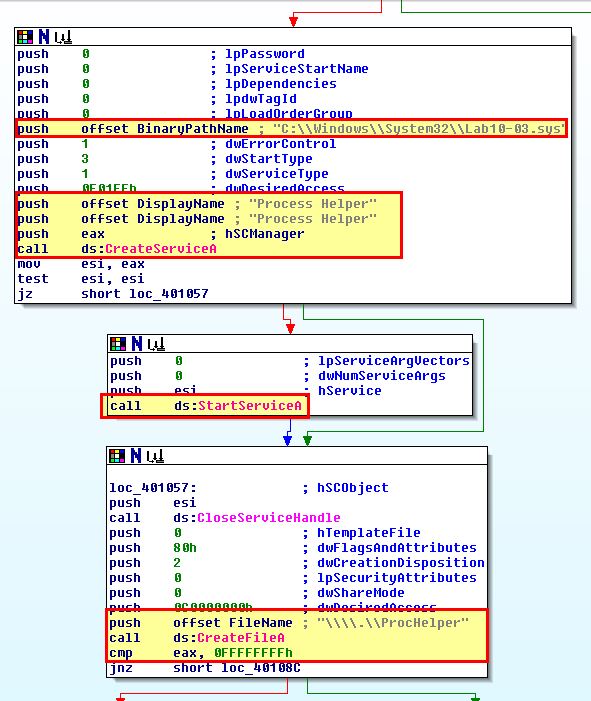
Based on this we can make an informed decision that a device will be created by the kernel driver at \.\ProcHelper which will allow communication between the user component Lab10-03.exe, and the kernel driver component ‘Lab10-03.sys’.
To understand what is being sent to the kernel driver prior to digging into that further we can take a look at what is being passed to “DeviceIoControl’. We can also see some calls to OleInitialise and CoCreateInstance which lead us into believing that a COM object will be created and used by this executable which in this instance we can see is what’s being used to open IE in a loop to show the advertisement webpage.
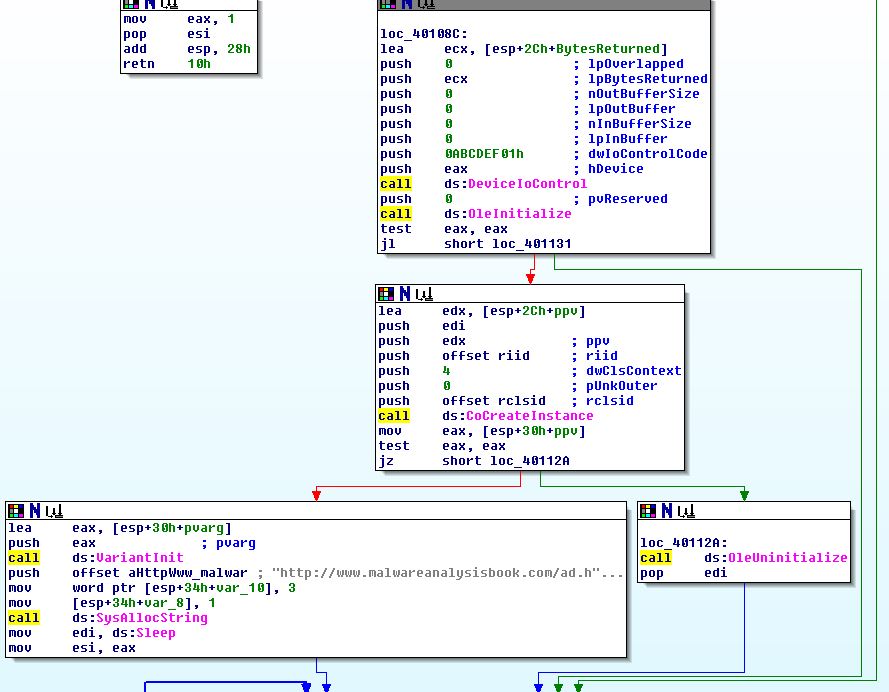
Of interest is that null (0) values are being sent through lpOutBuffer and lpInBuffer which indicates no input or output values are expected, and that only ‘0ABCDEF01h’ needs to be sent as the control code to the kernel driver which we will dive into further in the following questions. More information on this operation can be found under the DeviceIoControl function.
Question 2
Once this program is running, how do you stop it?
Answer 2
By opening Process Explorer or Task Manager prior to running lab10-03.exe, we can see that there is an instance of internet explorer running which is spawning advertisements through the initialised COM object; however, there’s no mention of lab10-03.exe
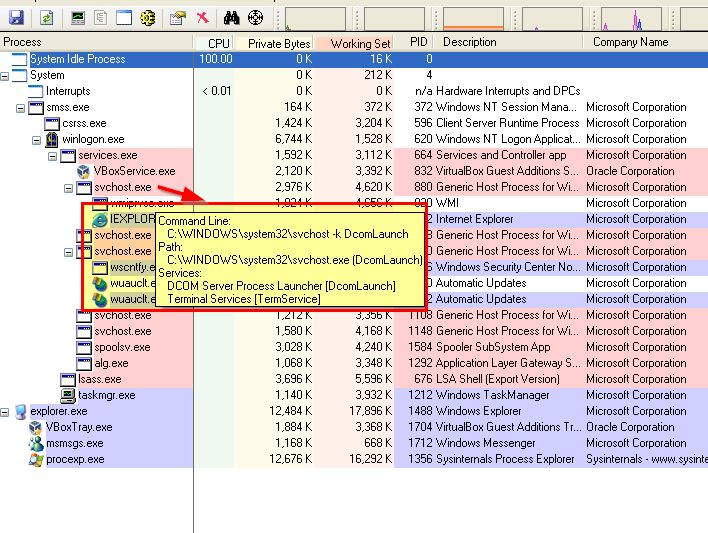
If we kill internet explorer the advertisement popups will stop. This is because the looping component that appears to be spawning these windows comes from the iexplore instantiated COM object rather than lab10-03.exe itself and there’s no redundancy to reinstantiate the COM object.
Having said this we still see no evidence of lab10-03.exe which may be still running. To understand why we begin to dig further into the kernel driver.
Question 3
What does the kernel component do?
Answer 3
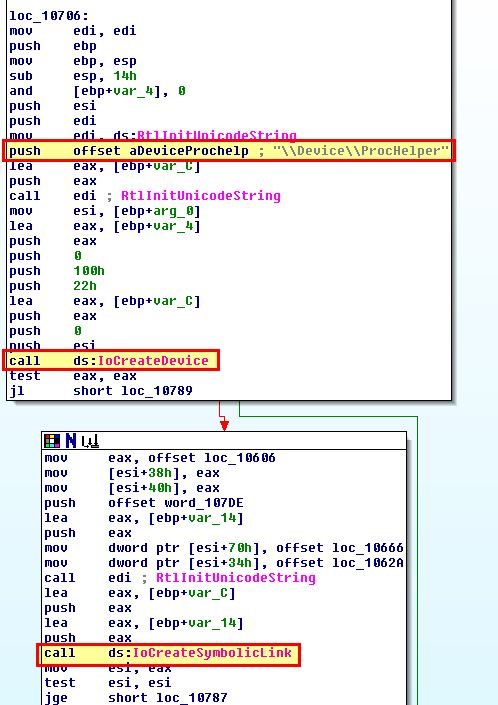
Opening up lab10-03.sys in IDA we can see that it does create a device, and a symbolic link. In this instance the symbolic link DosDevices\ProcHelper redirects to \Device\ProcHelper which allows the user application to communicate with the kernel driver.
From here if we move back to debugging the kernel driver, we can search directly for the device object ‘ProcHelper’ so long as the service “process helper” is running, and then use the address of the driver object to gather more information about the object.
!devobj ProcHelper
dt nt!_DRIVER_OBJECT 86576500
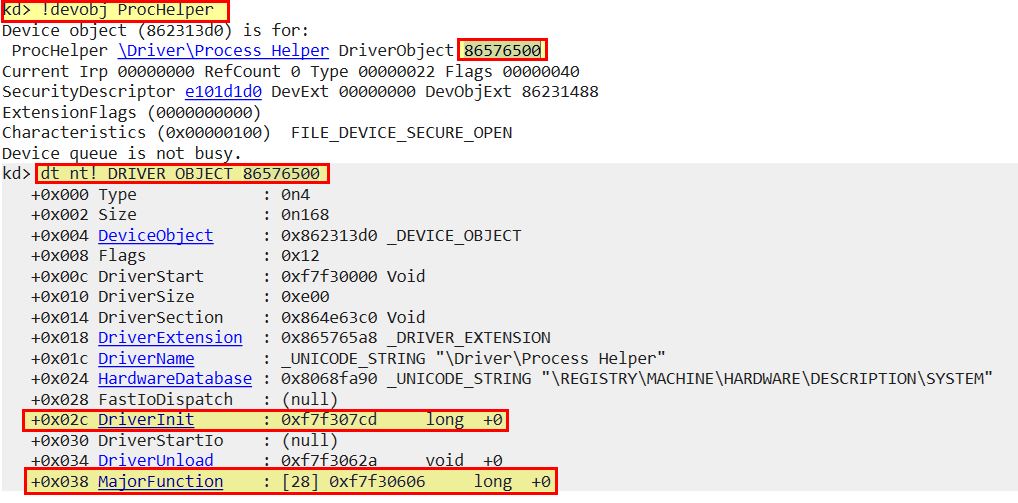
Of most relevance to us is the DriverInit and Major function address locations. To get more information about major functions this implements we can use ‘dd’ and specify the address + the offset identified.
dd 86576500+0x38
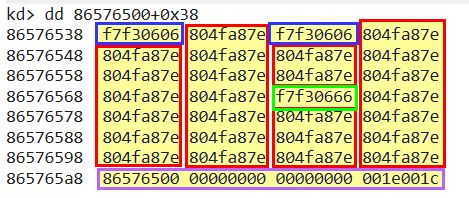
Looking at the above we can see that there’s 3 unique functions implemented, and what looks to be noise data that doesn’t fit right at the bottom (this is because we’ve retrieved more than the max amount of major functions shown when we identified this offset).
To fix this we can specify the max amount of results to retrieve in hex ‘L1C’ (1C is hex for 28 in decimal which we saw previously), the new command would be as follows:
dd 86576500+0x38 L1C
Moving back to our results we can see the following valid Major functions implemented:
- f7f30606
- 804fa87e
- f7f30666
To get an idea of what these are you can use the ‘ln’ command if you have debugging symbols installed to get the names nearest to these locations:
ln f7f30606
ln 804fa87e
ln f7f30666
If this doesn’t return results we can also go browsing with ‘dps’ similar to our previous query with ‘dd’.
dps 86576500+0x38 L1C
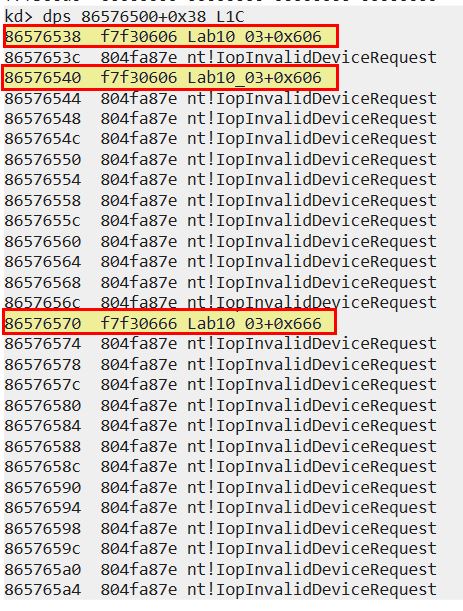
From here we can see that the most common major function implemented is ‘nt!IopInvalidDeviceRequest’ which is basically a catch all for any function that this driver doesn’t implement. The others now specify their offset of ‘Lab10_03+0x606’ and ‘Lab10_03+0x666’.
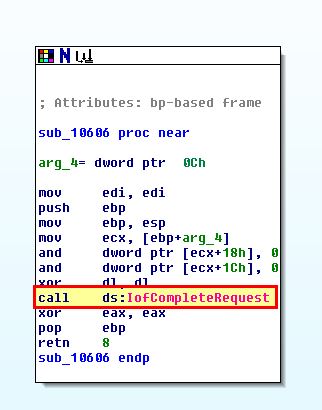
Moving back to IDA, if we decompile this and from the start function jump to these offsets, we can find out what these functions are performing.
- Lab10_03+0x606
- Lab10_03+0x666
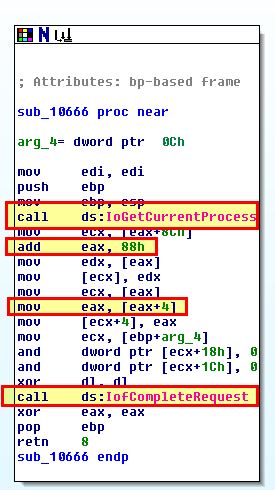
From the above we can see that offset 0x606 doesn’t do much besides call a function to indicate that processing of this I/O request is complete. The offset 0x666 on the other hand is calling IoGetCurrentProcess which we identified earlier, before accessing data at 0x88, and 0x8C (0x88 + 4).
If we look at what is returned from a call to IoGetCurrentProcess we find out that it is a pointer to the current process, ref:IoGetCurrentProcess function. To understand how this looks from a kernel point of view, we need to understand that the opaque structure for a process object is ‘EPROCESS’, ref:Windows kernel opaque structures.
Knowing that an EPROCESS structure will be returned for the process that made the call to this function, we can move back to our debugger and find out what resides at 0x88 and 0x8C of this structure.
dt nt!_EPROCESS
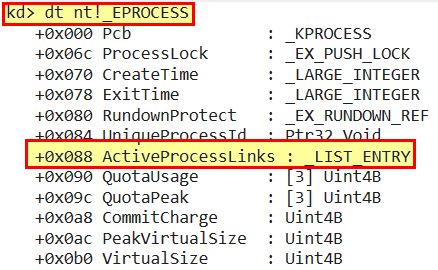
As nothing falls at 0x8C, but this falls before 0x90, we can conclude that both relate to a LIST_ENTRY structure of ActiveProcessLinks. Once again we now need to look into what constitutes a LIST_ENTRY structure, Ref:LIST_ENTRY structure
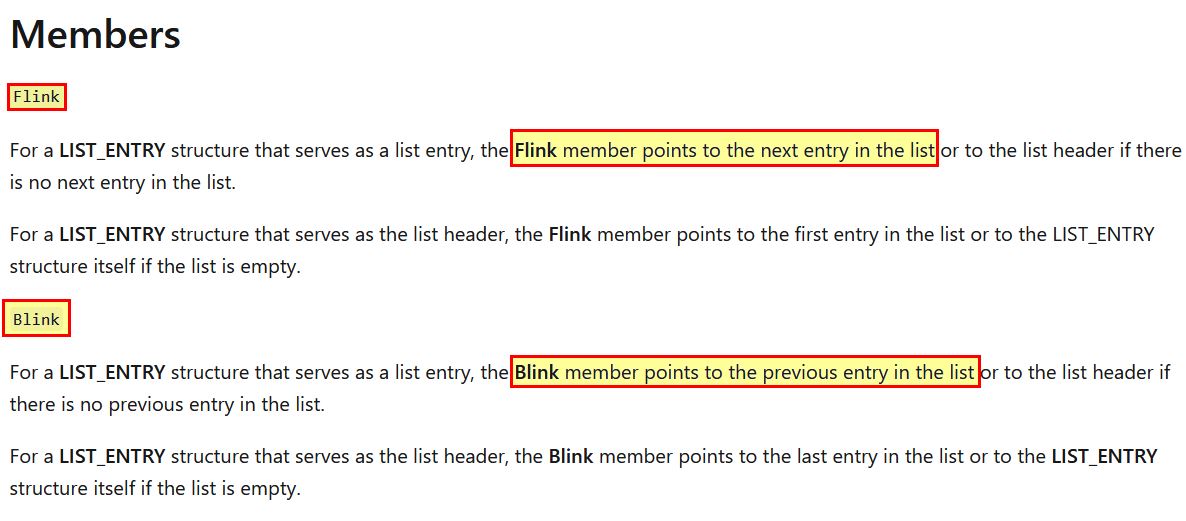
From the above documentation we can see that there’s 2 main members we need to be aware of:
- Flink
- Blink
Revisiting the function at Lab10_03+0x666 with this knowledge we can begin to piece together what this does.
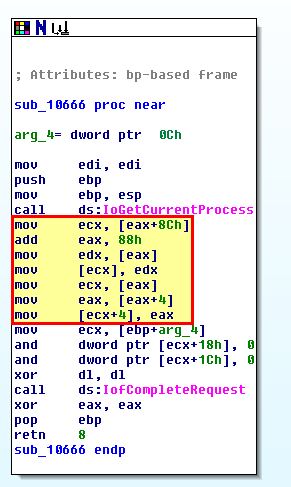
We know that adding 4 now is to move to the next EPROCESS structure based on the number of members in the LIST_ENTRY structure. The main function of this driver now begins to look like the below.
mov ecx, [eax+8Ch] - Get the next EPROCESS object from its relevant LIST_ENTRY retrieved from ActiveProcessLinks.
add eax, 88h - Access data at offset 0x88 (LIST_ENTRY structure).
mov edx, [eax] - Point to an entry at an offset of 0x88 (previous entry in list).
mov [ecx], edx - Overwrite Blink to point to the previous entry in the list (This effectively skips the calling process).
mov ecx, [eax] - Point to an entry at an offset of 0x88 (previous entry in list).
mov eax, [eax+4] - Overwrite Flink to point to the previous entry in list (This effectively skips the calling process).
mov [ecx+4], eax - Point to next entry.
Put more simply the kernel component performs the following after a call is made by a process to ‘Lab10_03+0x666’ (f7f30666 - DeviceIoControl).
- The next Active Process from a list containing EPROCESS structures is retrieved.
- This is modified to set the previous linked process to skip over the process that made this call when looking forward.
- This is modified to set the next linked process to skip over the process that made this call when looking backward.
- The end result is that the calling process is unlinked and becomes invisible when viewed by a user.
This concludes chapter 10, proceed to the next chapter.