
Practical Malware Analysis - Chapter 16 Lab Write-up

Chapter 16. Anti-Debugging
Windows API: Most obvious technique
- IsDebuggerPresent: Most simple, searches Process Environment Block (PEB) for the field ‘IsDebugged’.
- CheckRemoteDebuggerPresent: Almost identical to ‘IsDebuggerPresent’. Takes a handle to a process, and will check PEB for if debugger is present on local machine.
- NtQueryInformationProcess: Takes a handle to a process, and the information to be retrieved, and retrieves this from a process. Can use ‘ProcessDebugPort’ (0x7) to check if being debugged.
- OutputDebugString: Sends string to a debugger. Can use an if statement in tandem to run malware if this doesn’t return an error to check if being debugged.
Mitigations:
- Hook API calls.
- Modify code to not call APIs.
- Modify checks to jump to the intended path in all instances.
Manually Checking Structures: Most common technique
PEB of process is at fs:[30h]
- BeingDebugged Flag: Can be checked by comparing the value of fs:[30h] + Offset of 2 to determine in the PEB of a process if ‘BeingDebugged’ is set or not.
- ProcessHeap Flag: Can be checked by first comparing the value of fs:[30h] + Offset of 0x18 to get the ‘ProcessHeap’, and then comparing an offset of 0x10 within the ‘ProcessHeap’ (Windows XP) to find the ‘ForceFlags’ field. In Windows 7 (32-bit binaries) this is at 0x44. We can also check an offset of 0x0C (Windows XP) or 0x40 (Windows 7) to find the ‘Flags’ field.
- NTGlobalFlag: Can be checked by first comparing the value of fs:[30h] + Offset of 0x68 to the value 0x70 to determine if the heap combination indicates a debugger is set.
- System Residue: Can check system for artefacts a known debugger is installed, e.g. registry keys of installed software, files/directories, processes running etc.
Mitigations:
- Most popular OllyDbg plug-ins at the time of PMA publishing include ‘Hide Debugger’, ‘Hidedebug’, and ‘PhantOm’. Many seem to now be deprecated or superseded.
- The most popular free Ant-Anti-Debug library (Ring 3) at the time of this post is ScyllaHide.
- The most popular free Anti-Anti-Debug driver (Ring 0) at the time of this post is TitanHide.
- Debuggers can be started with the debug heap disabled. For example the following using windbg: windbg –hd
.exe - Modify comparison checks to jump to the intended path in all instances.
Identifying Debugger Behavior:
- INT Scanning: INT 3 (0xCC) is commonly used to set a break via a debugger, INT
can also be used (0xCD). Malware can scan its own code for these (e.g. 0xCC) to find software break points. - Code Checksums: By verifying the malware’s own code integrity (e.g. via a CRC or checksum of opcodes), malware can determine if software break points may be present or their code has been tampered with.
- Timing Checks: One of the most popular techniques. Uses delay in time between operations to infer a debugger is present.
- rdtsc Instruction: Most common. Uses opcode 0x0F31 (returns tick count) at least twice. Where the difference is > than X amount it will not run the intended code.
- QueryPerformanceCounter and GetTickCount: Similar to the above but uses Windows APIs.
Mitigations:
- Use hardware break points.
- Create break points after timing checks and step over them.
- Modify comparison checks to jump to the intended path in all instances.
Interfering with Debuggers:
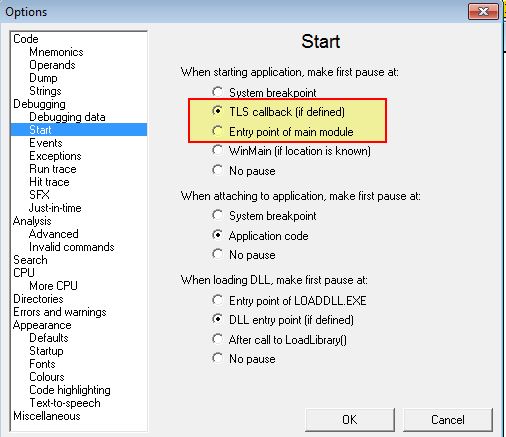
- Using TLS Callbacks: TLS Callbacks (Thread Local Storage Callbacks) run before the programs first instruction so are often missed by debuggers. Programs implementing this generally have a .tls section in the header and most normal programs don’t use this. Can be mitigated by setting debuggers to break at System, break-points (e.g. Options > Debugging Options > Events) or TLS callbacks.
- Using Exceptions: By detecting if an exception is passed back to the program running, the program can infer if a debugger is being used. Can be mitigated by setting a debugger to pass exceptions back to the running process (e.g. Options > Debugging > Options > Exceptions).
- Inserting Interrupts: USed to slow down, disrupt, or annoy an analyst by inserting software breaks interpreted by debuggers.
- INT 3: Emulates a software break by inserting 0xCC or 0xCD03 (used to advance EIP by 1-byte when debugged using WinDbg).
- INT 2D: Similar to INT 3, but uses 0x2D to instead emulate a kernel debugger.
- ICE: Undocumented In-Circuit Emulator (0xF1). Generates a single-step exception. Can be mitigated by not single-stepping over an icebp (0xF1) instruction.
Debugger Vulnerabilities:
- PE Header Vulnerabilities: By modifying certain PE Headers to a number greater than the max value possible, certain debuggers will follow this and cause the program execution to crash, whereas under normal running conditions, the OS would ignore anything outside of the max values. Some fields include NumberOfRvaAndSizes (Max 0x10), SizeOfRawData (Max size is generally only that of VirtualSize given the smaller is mapped to memory, and OllyDbg only uses SizeOfRawData. If specifying more than the size available, it will crash). This can be mitigated by setting the SizeOfRawData close to that of VirtualSize.
- OutputDebugString Vulnerability: OllyDbg 1.1 has an OutputDebugString vulnerability (like many of the other vulnerabilities mentioned), where a string of “%s” as a parameter to OutputDebugString can cause it to crash. Mitigations include using version 2.0 of OllyDbg.
Lab 16-1
Analyze the malware found in Lab16-01.exe using a debugger. This is the same malware as Lab09-01.exe, with added anti-debugging techniques.
Question 1
Which anti-debugging techniques does this malware employ?
Answer 1
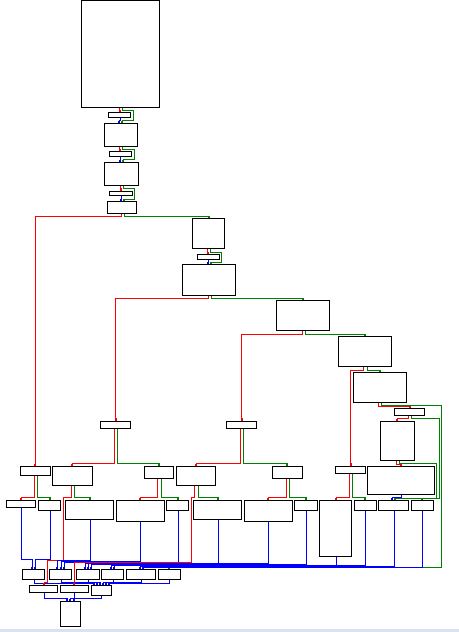
Given this incorporates anti-debugging techniques a good place to start is with a disassembler rather than a debugger. At first glance we can see a number of different jumps and conditional flows by viewing the graph overview.
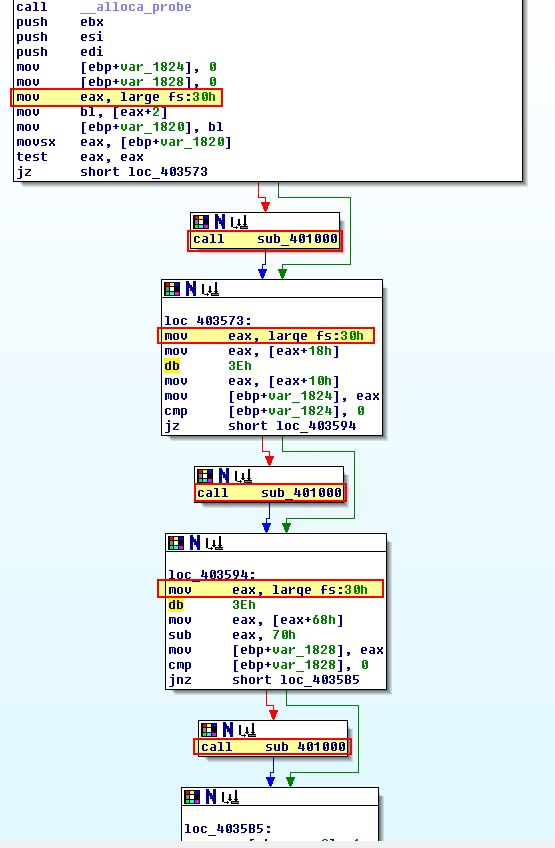
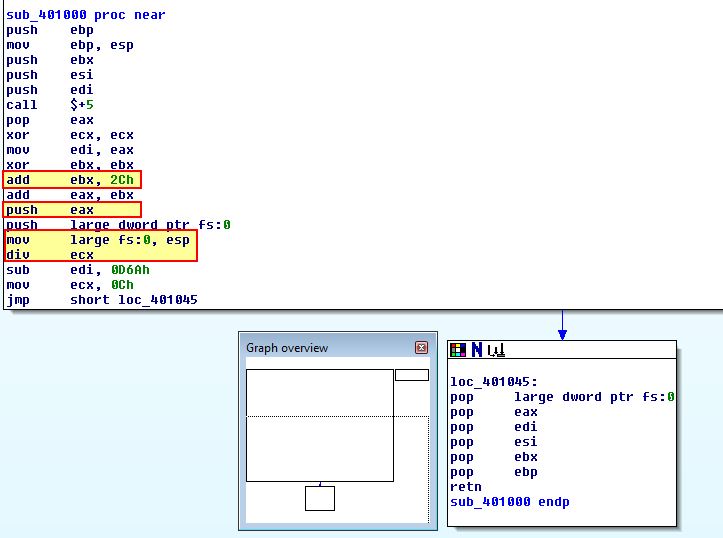
Drilling into the conditions surrounding the main method we can see a number of comparisons after an moving instances of ‘fs:30h’ into EAX, in addition to calls to ‘sub_401000’ where an expected condition isn’t met.
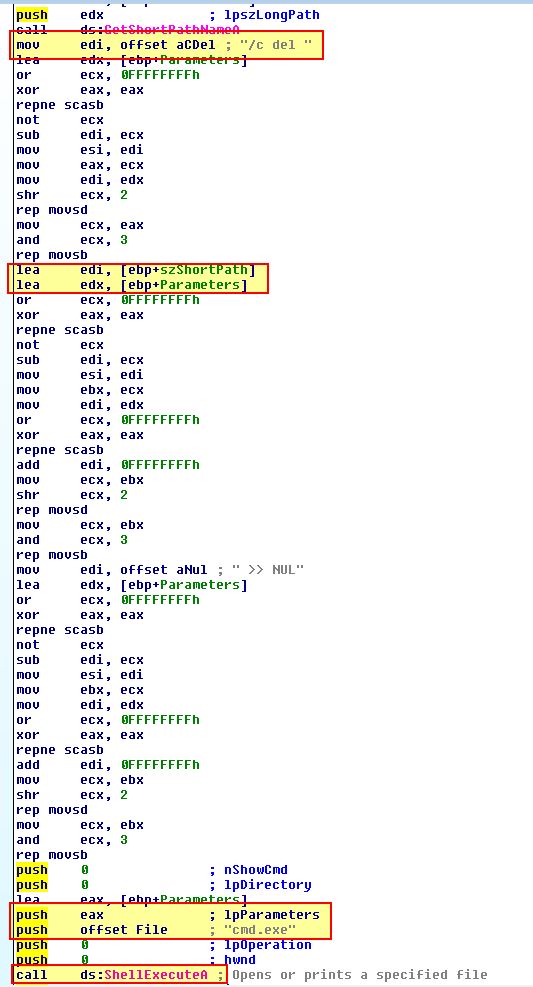
If we examine sub_401000 closely we can see that it is designed to delete the calling binary, indicating not only that this is using some sort of anti-debugging technique, but also that when it identifies it is being debugged, it tries to delete itself.
Drilling into all of the comparisons which use reference to “fs:[30h]” (The Process Execution Block) of the process running, we can see a number of comparisons checking if the ‘BeingDebugged’, ‘ProcessHeap’ or ‘NTGlobalFlag’ have been set.
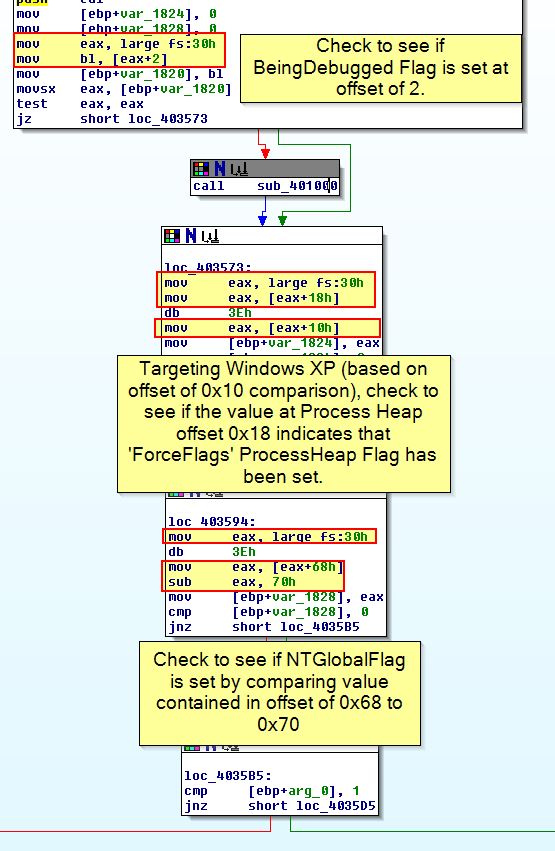
We can confirm what we’ve said by looking at the documentation around PEB structures, noting that some elements are undocumented.
Question 2
What happens when each anti-debugging technique succeeds?
Answer 2
As mentioned in the above analysis, if at any point the anti-debugging techniques succeed sub_401000 will be run which attempts to delete itself and terminate the program.
Question 3
How can you get around these anti-debugging techniques?
Answer 3
There’s a few different ways to get around these anti-debugging techniques explored below.
- OllyDbg Plugin.
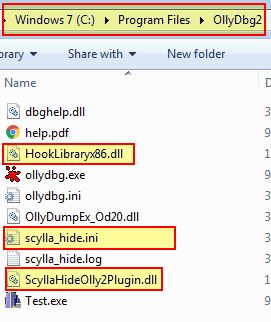
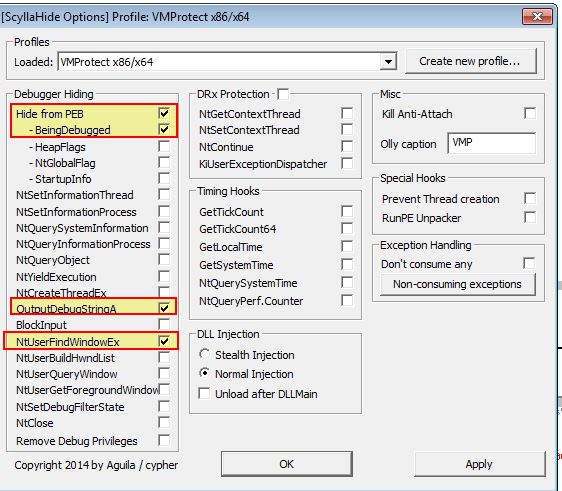
By far one of the easiest ways to defeat this anti-debugging technique is to use a plugin such as ScyllaHide. By getting the latest release of this and installing it into our OllyDbg2 directory (in this case we are using version 2.01).
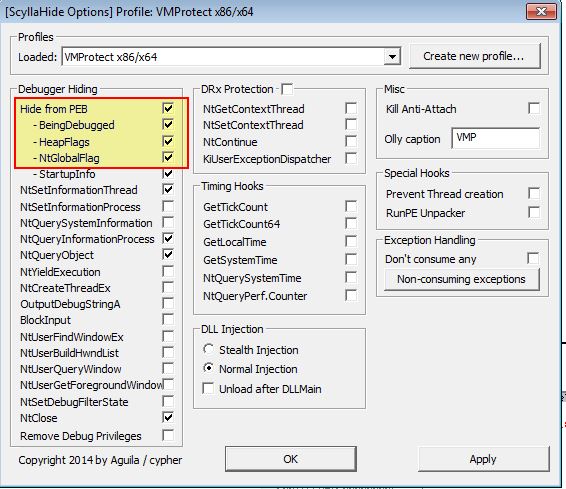
We can now access these components via Plugins > ScyllaHide > Options and setup a profile which will hide the identified anti-debugging components from the inspected PEB.
At this point we’re in the clear and can debug the program as normal.
- Modify comparison checks to jump to the intended path in all instances.
This method is much more tedious; however, we could manually go through and patch the binary, either in memory or by modifying it’s raw hex to change all instances of anti-debugging jump conditions to be opposite.
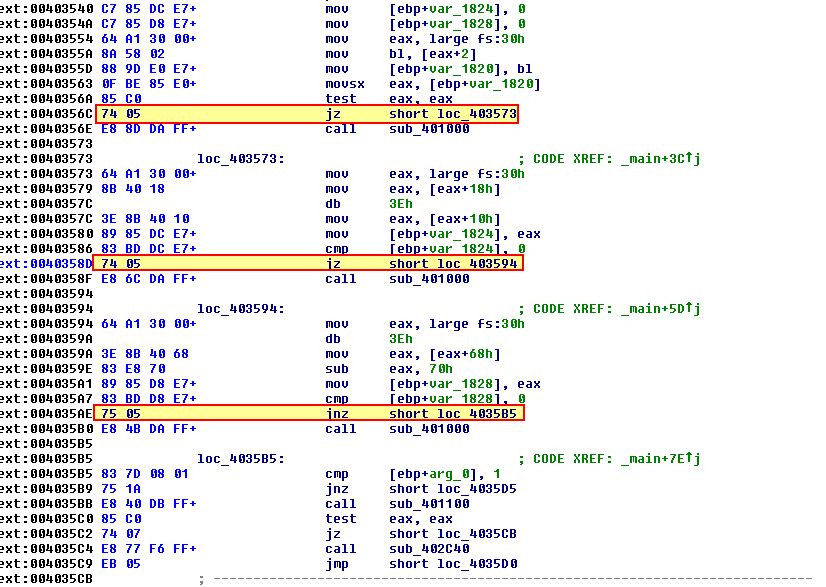
In the above jump conditions occur using both JZ and JNZ, to make them opposite we simply change instances of ‘74’ to ‘75’ and vice versa on appropriate anti-debugging checks.
- Patch the structures using ImmunityDebugger PyCommands.
This method can also be used if we are leveraging ImmDbg (ImmunityDebugger) as our debugger of choice. It comes with a pycommand called ‘hidedebug’ which can be called to patch the appropriate PEB structure elements.
Question 4
How do you manually change the structures checked during runtime?
Answer 4
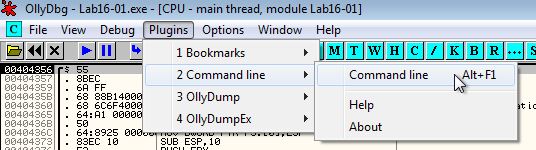
To manually change the PEB structures checked during runtime we can first debug the program using Ollydbg 1.10 (this gives us access to the command line plugin).
BeingDebugged:
Using the command-line plugin we can dump the contents of PEB with the below.
dump fs:[30] + 2
From here we can change the ASCII representation of what we can only assume is a face, and fill this ‘01’ part of the binary with 00’s.
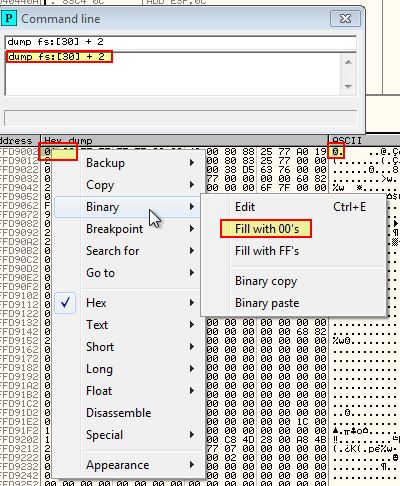
At this point we’ve manually modified this part of the PEB structure to prevent checks on the ‘BeingDebugged’ flag.
ProcessHeap:
Similar to the above, this time we’re looking for 4-bytes as this is the number of flags added on the ProcessHeap, and we’re going to check at an offset of 0x10 (given this was created for Windows XP).
dump ds:[fs:[30] + 0x18] + 0x10
We can once again fill these with 00’s.
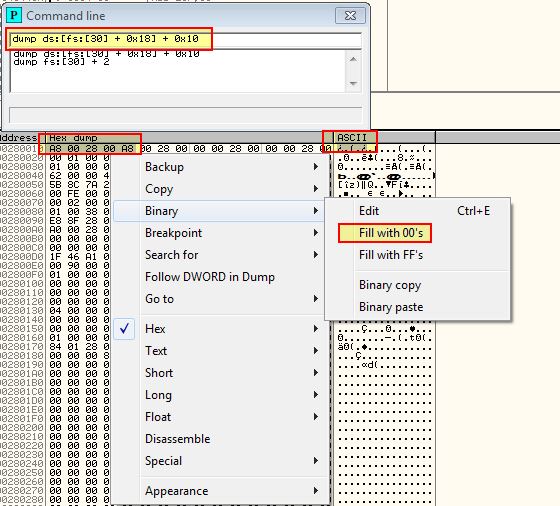
At this point we’ve successfully modified the ProcessHeap to prevent checks on the ‘ForceFlags’ field.
NTGlobalFlag:
Once again we will follow the PEB offset of 0x68 to find out whether the NTGlobalFlag is set to 0x70 or not.
dump fs:[30] + 0x68
We can see that it is, so once again we can modify this to be filled with 00’s.
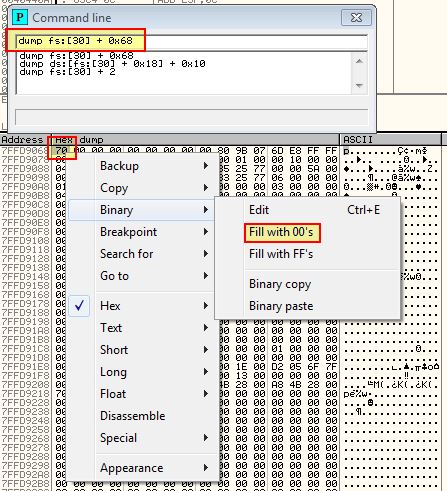
At this point we have successfully modified all these structures during runtime, and if we do this when the malware is run with an appropriate command-line as analysed in Lab09-1.exe we find that it successfully runs.
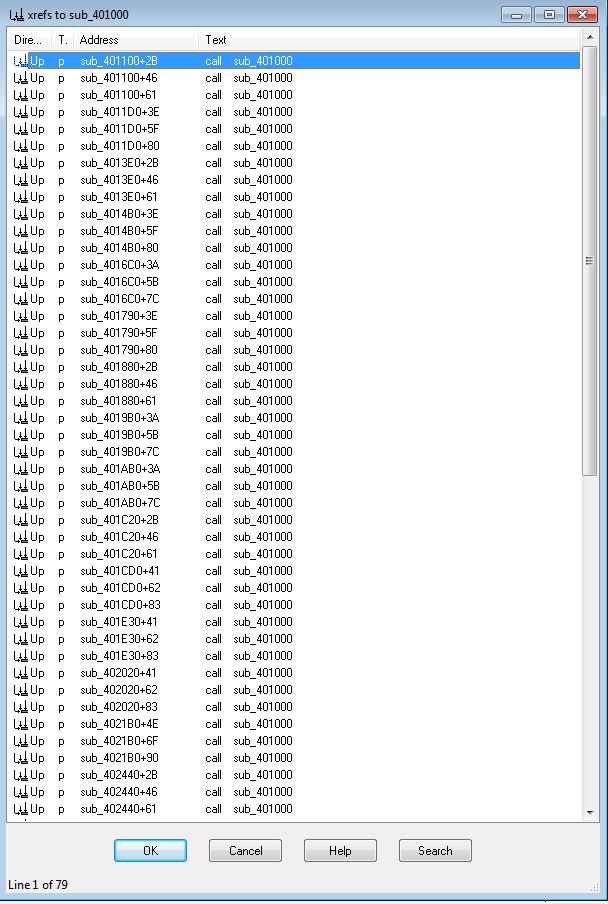
Of note is that if we’d taken the route to patch the program and bypass these checks we’d be in for difficult time. This is because if we were to examine cross-references to sub_401000 where the program attempts to delete itself, we find it has 79 entries which would need to be patched.
Question 5
Which OllyDbg plug-in will protect you from the anti-debugging techniques used by this malware?
Answer 5
As explored previously there are a number of anti-debugging plugins available in addition to a PyCommand that can be used through Immunity Debugger including HideDebug and ScyllaHide.
Lab 16-2
Question 1
What happens when you run Lab16-02.exe from the command line?
Answer 1
Running Lab16-02.exe from the command line we see that it prompts us to enter a 4 character password.

Question 2
What happens when you run Lab16-02.exe and guess the command-line parameter?
Answer 2
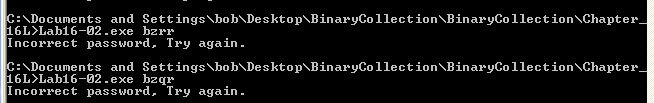
If we guess the command-line parameter (and get it wrong) Labe16-02.exe reports “Incorrect password, Try again”.

Question 3
What is the command-line password?
Answer 3
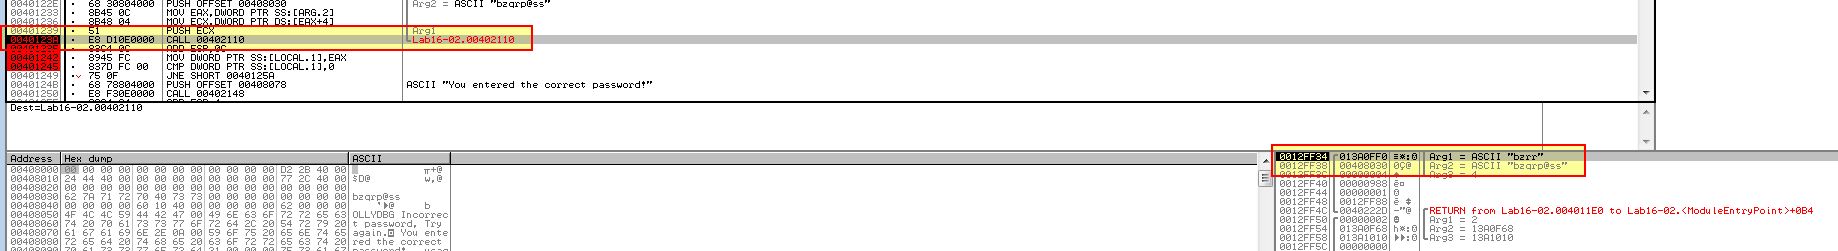
At this point it is too early to determine the command-line password. A quick glance using IDA Pro reveals a wealth of information, the first being that this pushes data to the stack prior to a string comparison taking place, and second that this is contained within a .tls section of the binary which is pretty uncommon, and probably indicates that anti-debugging techniques have been used.
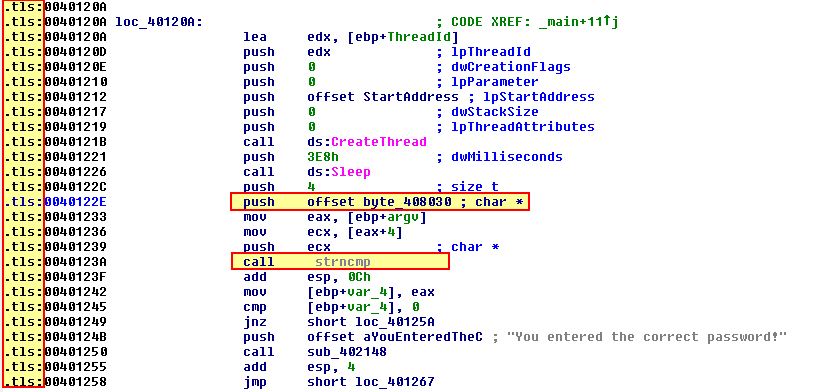
At a glance it looks like the data pushed to the stack may be performing a comparison to ‘p}’ or ‘p@ss’; however, there’s some references to 0FFH which may indicate memory registers, and the comparison doesn’t seem to add up. We also know that this is instructing a 4-character password, which although it could be a red herring, this together is enough to warrant further investigation.
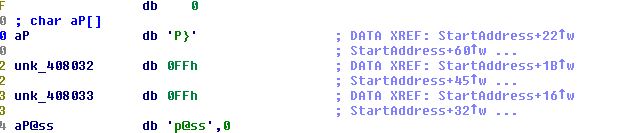
Upon trying password combinations we find they don’t appear to work, so we’ll continue to investigate the binary further and return to this question later.
Question 4
Load Lab16-02.exe into IDA Pro. Where in the main function is strncmp found?
Answer 4
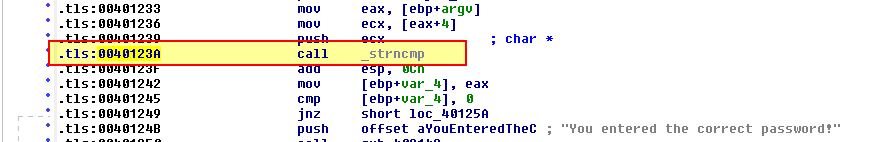
Within IDA Pro we find that the main function has ‘strncmp’ located at 0x40123A.
Question 5
What happens when you load this malware into OllyDbg using the default settings?
Answer 5
Opening this in OllyDbg or OllyDbg2 we find that it doesn’t hit any breakpoint upon loading and immediately terminates. To determine why we can take a look into the PE structure using PE-bear.
Question 6
What is unique about the PE structure of Lab16-02.exe?
Answer 6
PE-bear reveals that a .tls (Thread Local Storage) callback section is present which is intended to run before the programs main method.
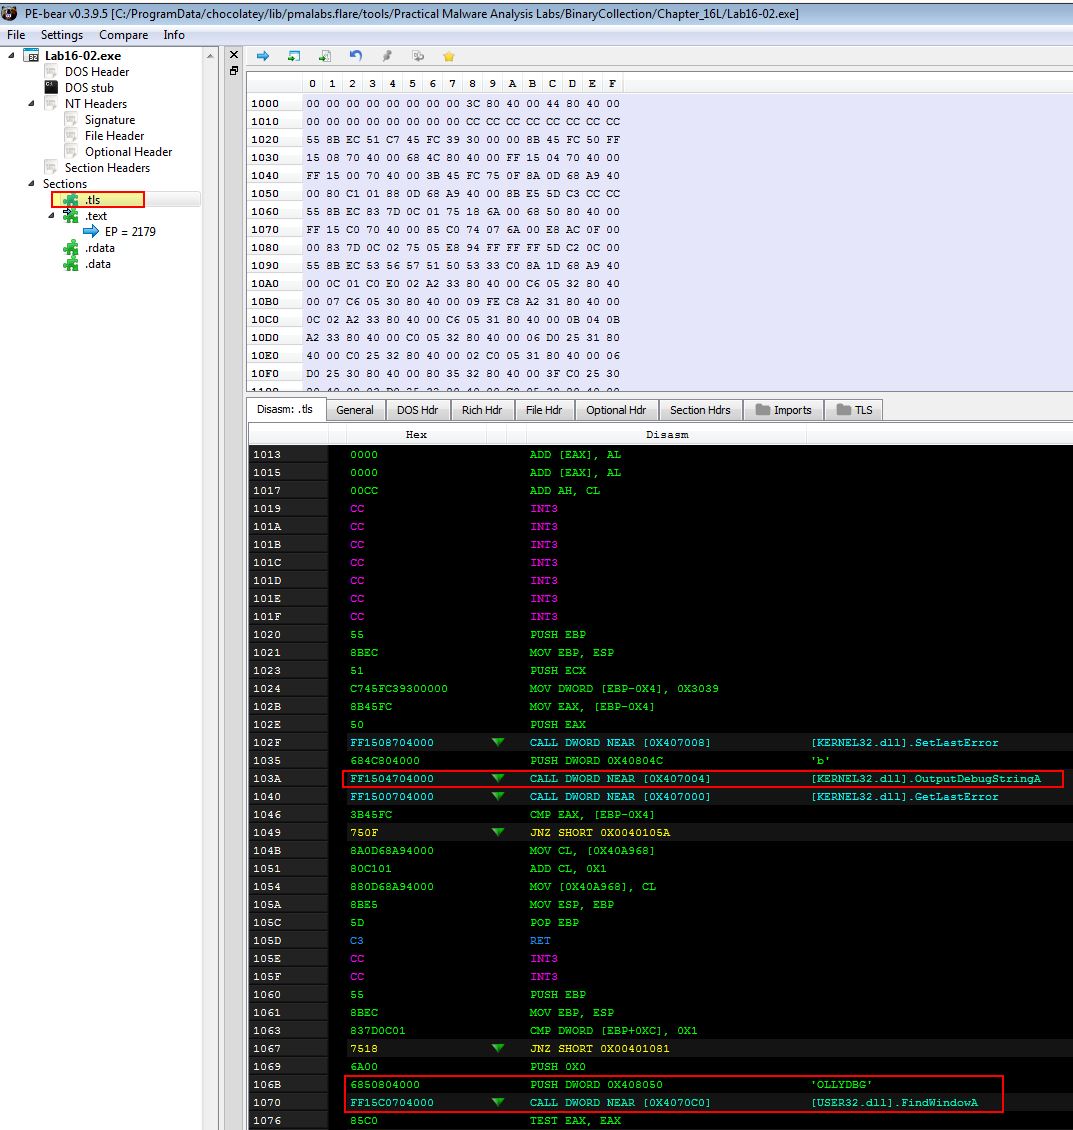
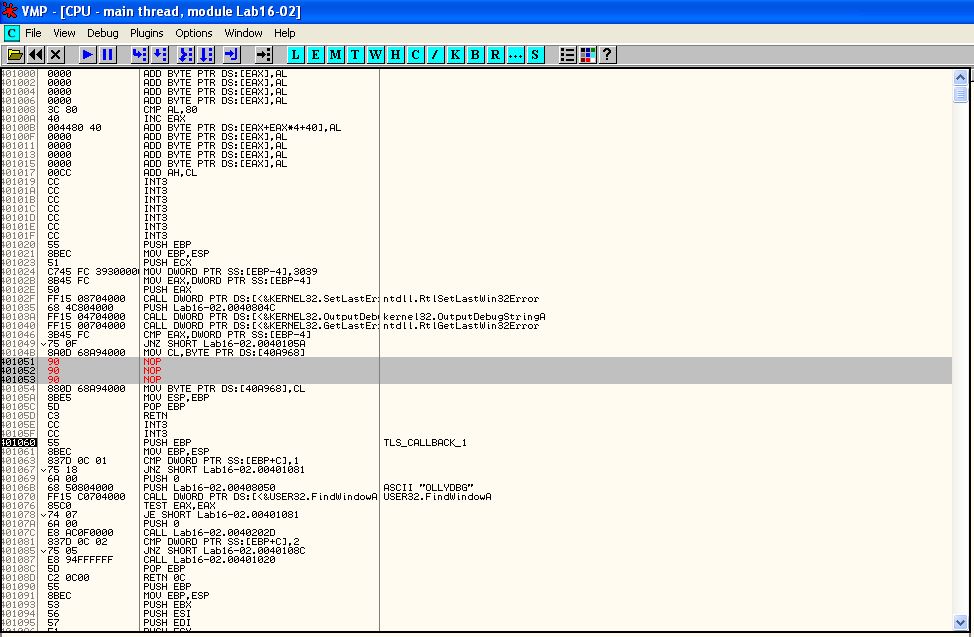
Using the in-build disassembler we can also see evidence this likely contains multiple anti-debugging techniques such as ‘OutputDebugStringA’ being used, and looking for any window called ‘OLLYDBG’.
Question 7
Where is the callback located? (Hint: Use CTRL-E in IDA Pro.)
Answer 7
We can find where the callback is located using PE-bear by shifting to the TLS tab.
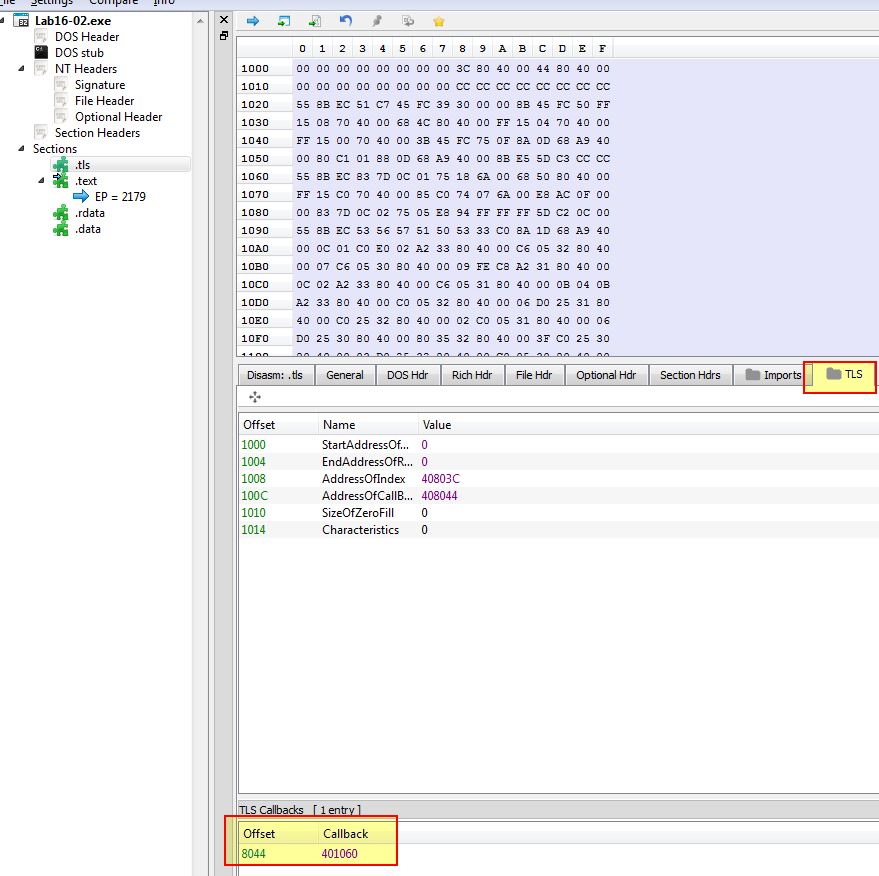
In addition we can use CTRL + E in IDA Pro to view this information and confirm.
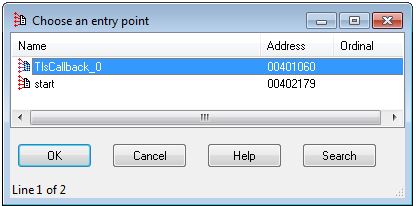
From this we know the callback is located at 0x401060.
Question 8
Which anti-debugging technique is the program using to terminate immediately in the debugger and how can you avoid this check?
Answer 8
Examining the tls callback further in IDA, we can see that this performs a check for any window called ‘OLLYDBG’.
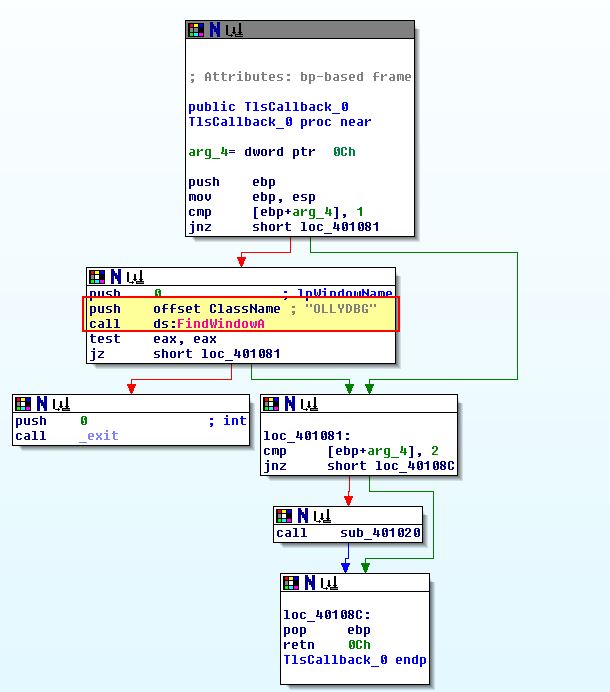
Where there are no instances of windows open with the name ‘OllyDbg’, it will continue to run the programs main method, otherwise it will terminate.
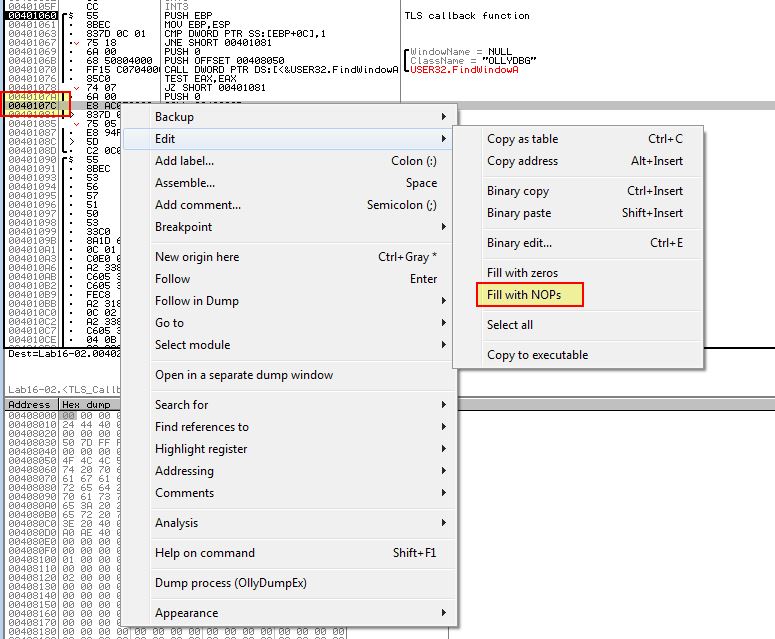
We can avoid this check by using another debugger, modifying the window class name while running in memory with a plugin, or bypass the check by setting it to be a ‘jnz’ jump instead of a ‘jz’ jump, or even just completely bypass the check by modifying it to be filled with as many 0x90 (NOP) operations as required.
Using Another Debugger:
Using Immunity Debugger we can see that this successfully bypasses these checks and pauses at the main method entry point.

Modify Window Class Name:
Using a plugin such as ScyllaHide we can easily change the Window Class Name and have this reflected as the newly running process name. Note this in itself won’t necessarily prevent this techinque. In addition we can hook NTUserFindWindowEX which is called by NTUserFindWindowA which will nullify the API call being made.
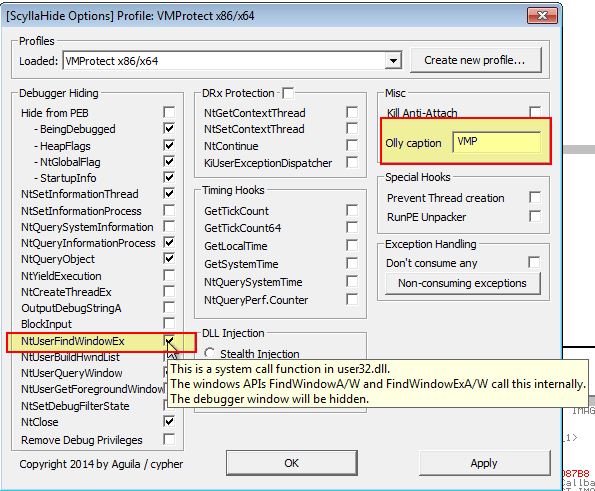
We may also need to add a break at the start of the tls callback if we’re stepping through this for the first time to see the difference in program termination due to this debugger check.
Modify Program:
By setting the break point in tls callback as shown above, we can modify this check in memory to change the JZ check to instead perform no operation and lead into the next section.
Question 9
What is the command-line password you see in the debugger after you disable the anti-debugging technique?
Answer 9
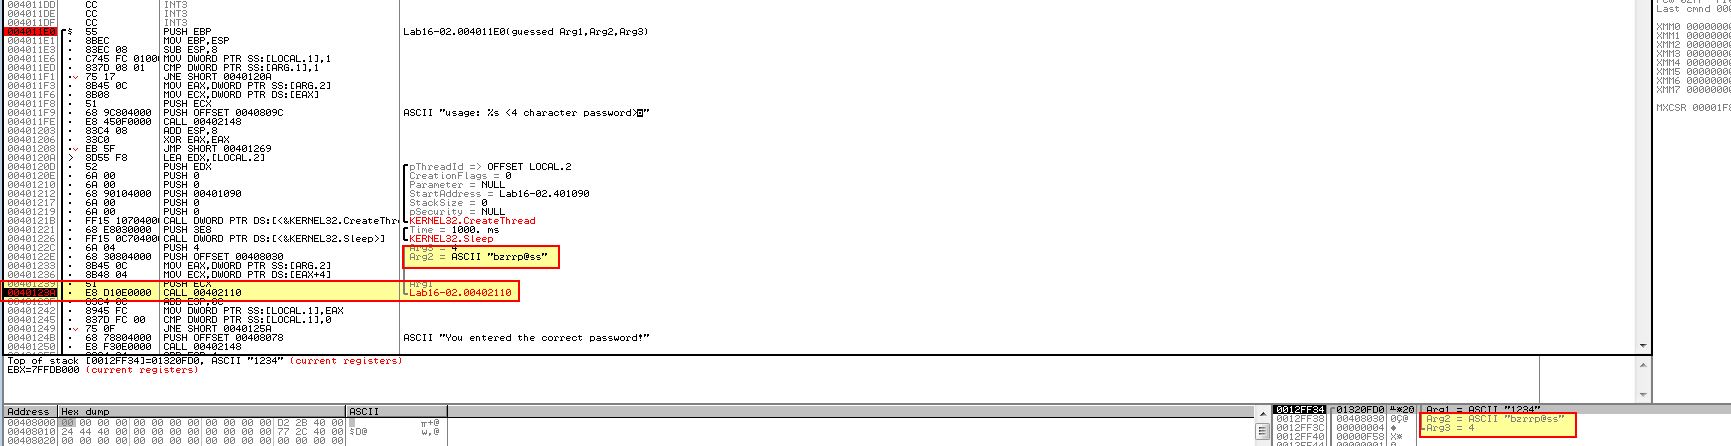
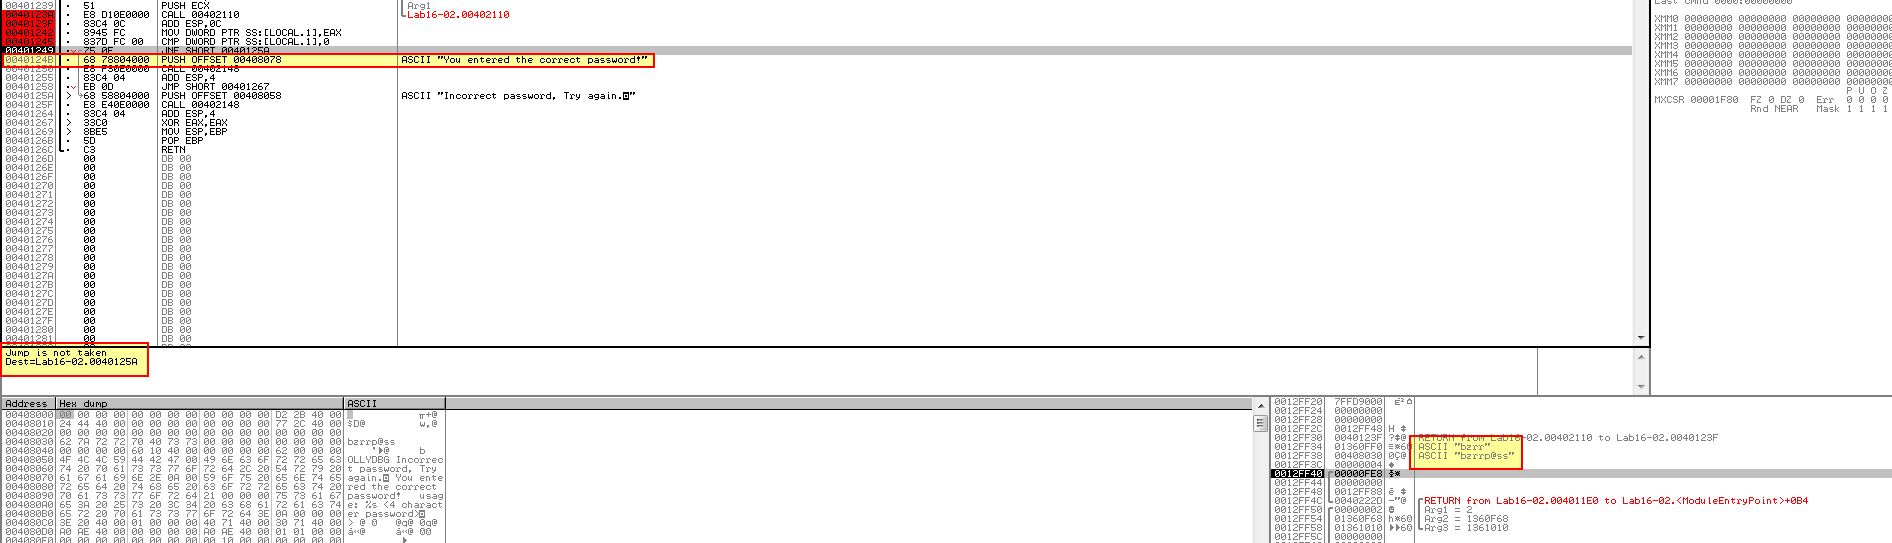
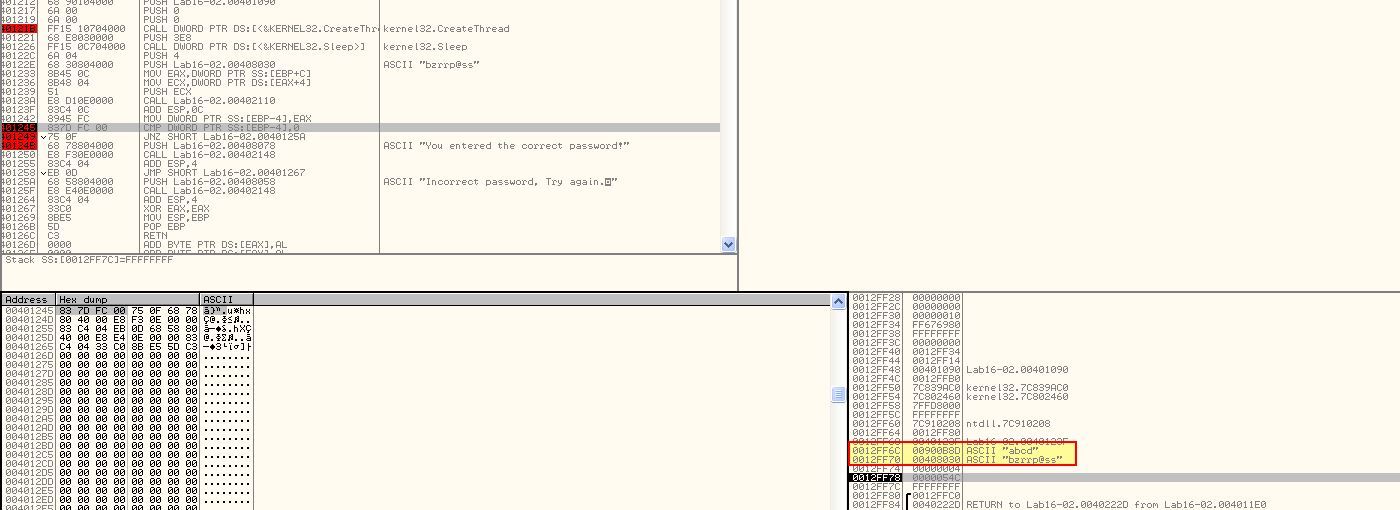
Setting a break point at 0x40123A (string compare operation) we can see a check against the password ‘bzrrp@ss’; however we can also see this is only looking to check the first 4 characters.
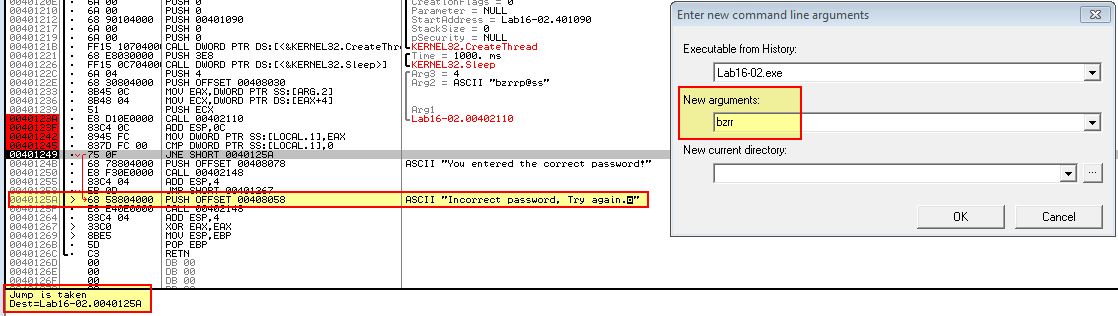
From this we infer that the password must be ‘bzrr’; however if we restart the program using OllyDbg2 and set this as the password command-line we still see that a jump is taken at 0x401249 which doesn’t add up to what we expect.
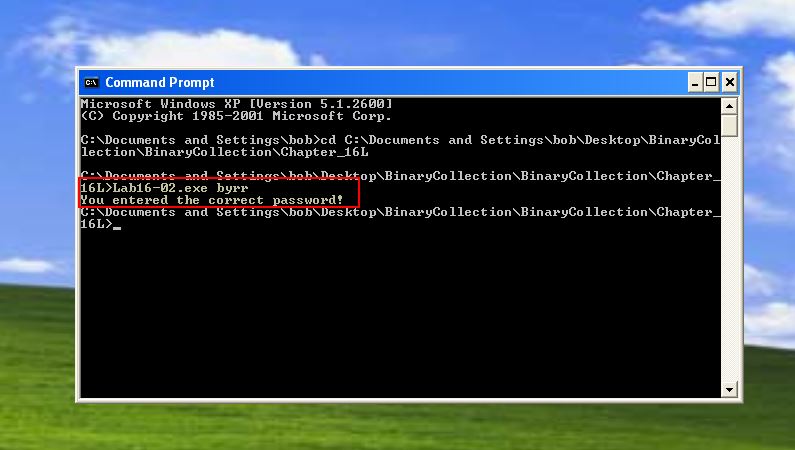
By running this outside of a debugger we can see that the password is in-fact correct.

From this we can infer that operations within the string compare statement have a level of anti-debugging techniques within them which are altering the expected password. In this case we’ve answered question 3 and now know bzrr is the password used when this application is not being debugged.
Question 10
Does the password found in the debugger work on the command line?
Answer 10
In our above analysis we have found that the password shown in the debugger does work on the command line, but only if further anti-debugging techniques don’t determine that it is currently running in a debugger. To figure out what is going on we will explore what is occurring before the string compare function in more depth.
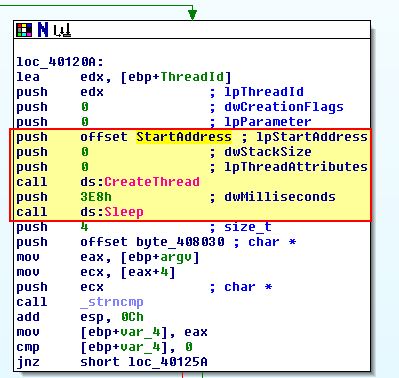
In the above we see that StartAddress is being pushed and started in a new thread, so we examine that further and find what looks to be a decoding routine.
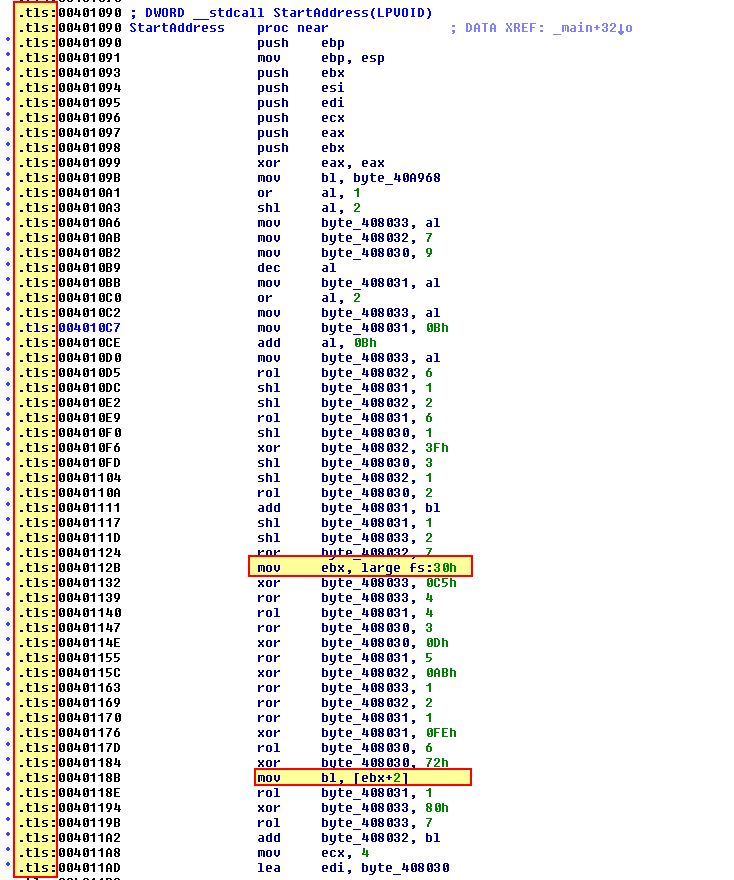
At a glance we also see reference to the program loading the PEB structure looking for an offset of 2, which we know is the ‘BeingDebugged’ flag in addition to us realising this is located within the .tls section of the program.
When we previously debugged the program we were using ScyllaHide which had a number of anti-debugging settings enabled, including one to remove the ‘BeingDebugged’ flag if it is set. By disabling this option and running the program again we see a different password output.
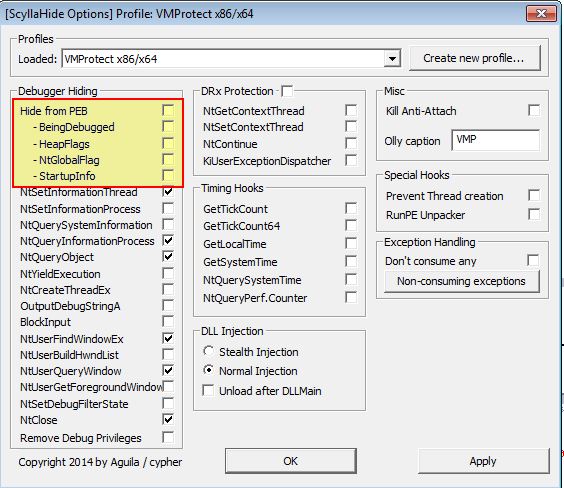
With the new comparison now looking for ‘bzqr’ we can infer that this anti-debugging technique has a direct influence on the password being checked by the application. Very tricky. Had we not set the ‘BeingDebugged’ flag to 0 we would have been presented with the wrong password which doesn’t work on the command-line.
Question 11
Which anti-debugging techniques account for the different passwords in the debugger and on the command line, and how can you protect against them?
Answer 11
Now that we know multiple anti-debugging techniques are involved, let’s first see if we can get the program to run through a debugger and the intended password. Back in question 6 we found reference to ‘OutputDebugStringA’ within tls, so we can begin to assume this is being used at a minimum. By enabling a hook to this we can try and debug again.
The end result is that we’ve successfully bypassed all anti-debugging components and the correct password now works with a jump not being taken using the password bzrr.
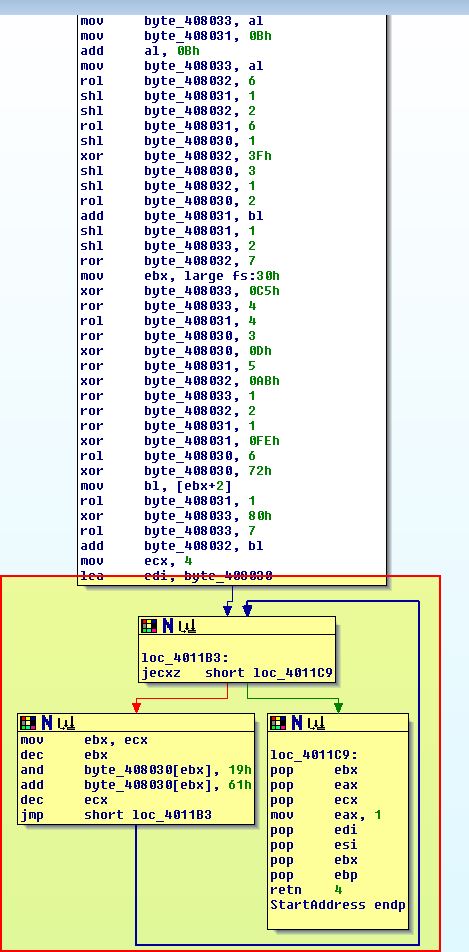
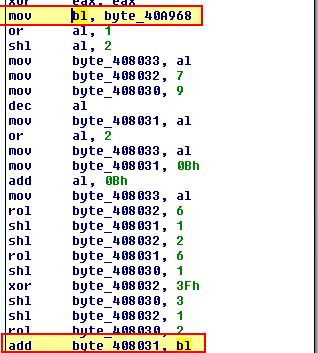
To determine how this is formed to assist in the event we cannot hook OutputDebugStringA (e.g. in Windows XP with the 32-bit variant of ScyllaHide when run inside OllyDbg 1.1) we’ll finally examine the decoding routine once more. At the start we see reference to ‘byte_40A968’ which is moved into ‘bl’ and appears to be used.
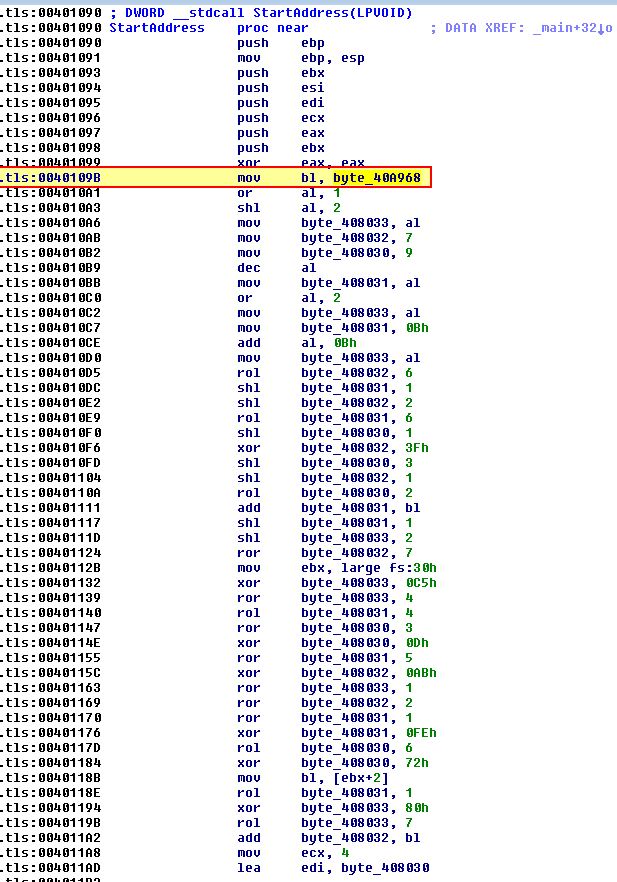
If we look into this it is created with the value ‘0’; however, if we examine cross-references to this by using ‘x’, we can see it has 4, of which 2 occur ‘UP’ (before) this operation within sub_401020 which is of interest.
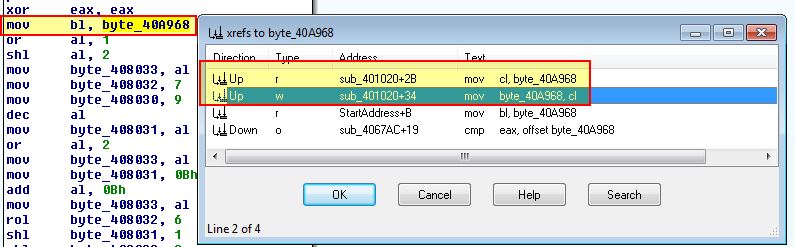
By examining sub_401020 we find that it makes a call to OutputDebugStringA with the string ‘b’ and an error code 0x3039. Where this is still present the program infers it is within a debugger and sets byte_40A968 to 1.
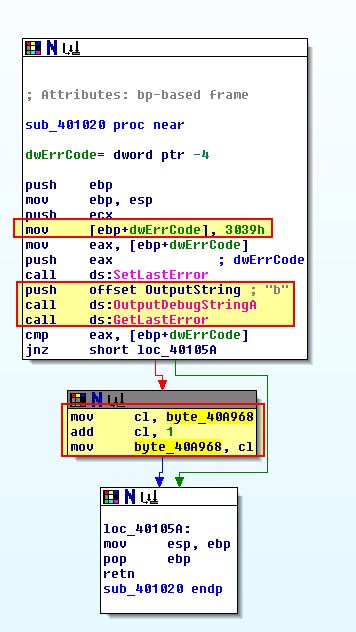
This is later used adding to a character in the decoding routine which explains why the value was one character off in our debugger results (bzqr instead of bzrr).
As a final thought: What is interesting is that these API calls and anti-debugging checks are very volatile, and given the password is based off of these calls, if they were to give a different output across operating systems, then the associated password check would be different. For example in the above we have run checks using a Windows 7 32-bit OS; however, the same binary yields different results when run on a Windows XP 32-bit OS when not run in a debugger using anti-debugging techniques, and a totally different password is required.
We can easily NOP out the operation which performs the +1 to our byte to nullify the impact of ‘OutputDebugStringA’ anti-debugging checks when using OllyDbg on a 32-bit OS with ScyllaHide.
By doing this we find that the password check is now ‘byrr’.
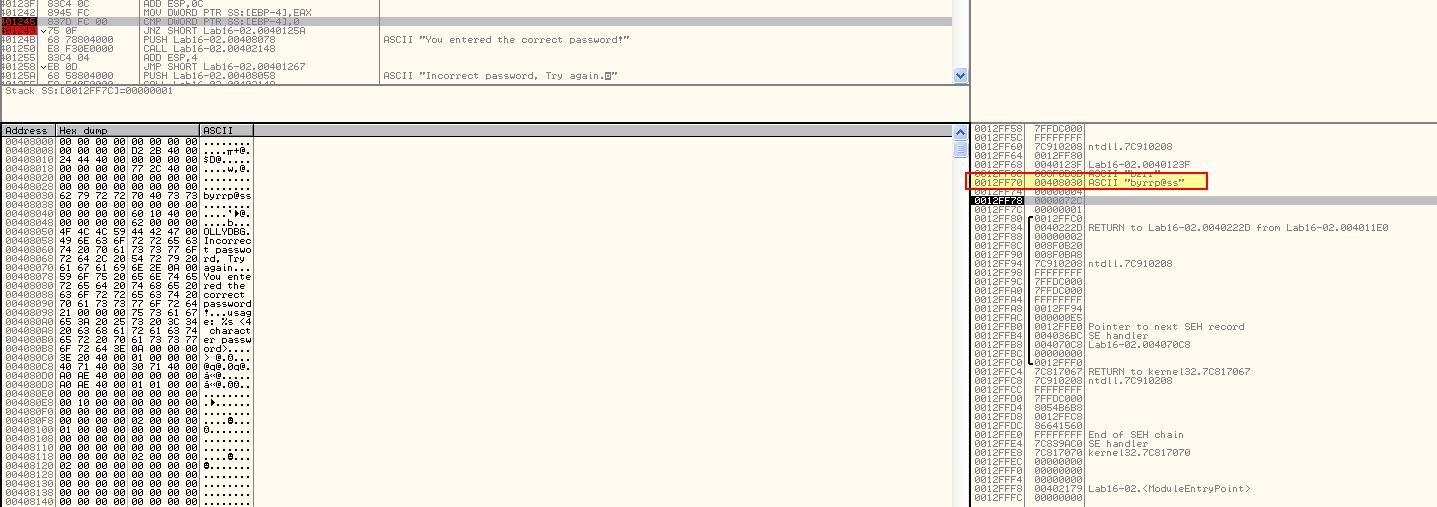
Failing to do this the check is still made against bzrr, indicating that the different operating systems are likely processing the checks against ‘OutputDebugStringA’ differently. Checking natively on Windows XP we find that the intended password without the OutputDebugStringA is now ‘byrr’.
This highlights the need to thoroughly examine anti-debugging features within a program to find any red-herrings and how they may operate differently on different versions of Windows. To summarise, the intended password for this on Windows XP when not operating within a debugger is ‘byrr’, with Windows 7 checks generally requiring ‘bzrr’.
Lab 16-3
Question 1
Which strings do you see when using static analysis on the binary?
Answer 1
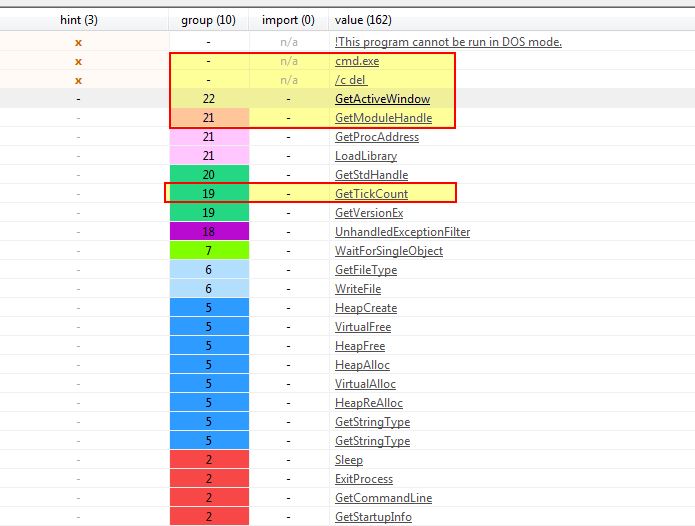
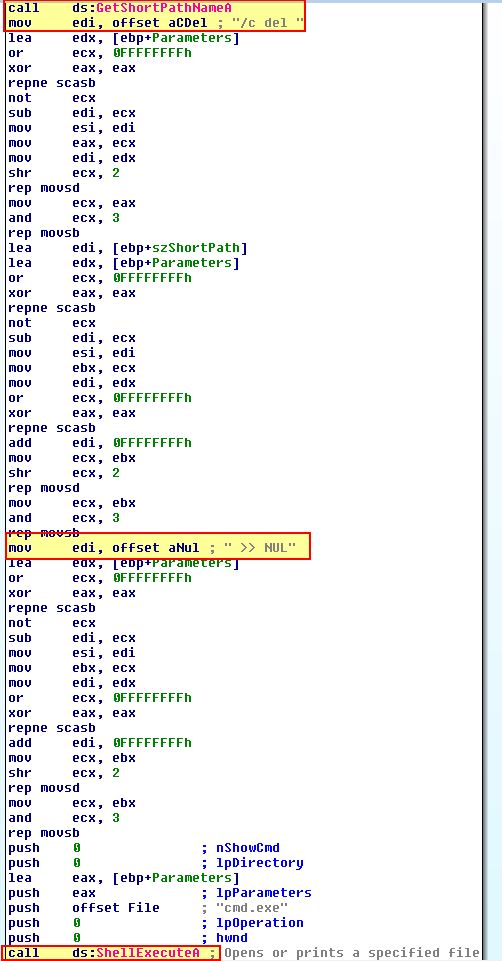
Opening the program usine pestudio we can see it contains some strings related to cmd.exe which looks like it may be trying to delete something, strings associated with getting access to the current window it is running within, and reference to GetTickCount which may be used for anti-debugging.
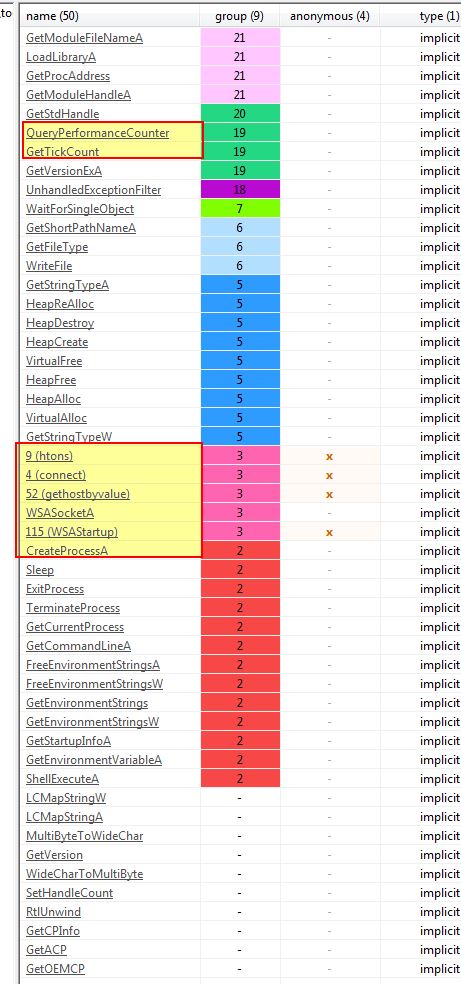
Looking at its imports we find more API calls which lead us to believe this is supposed to make network connections, and is performing more anti-debugging techniques.
Question 2
What happens when you run this binary?
Answer 2
If we try and run this binary it looks like it immediately terminates with no further actions taken.
Question 3
How must you rename the sample in order for it to run properly?
Answer 3
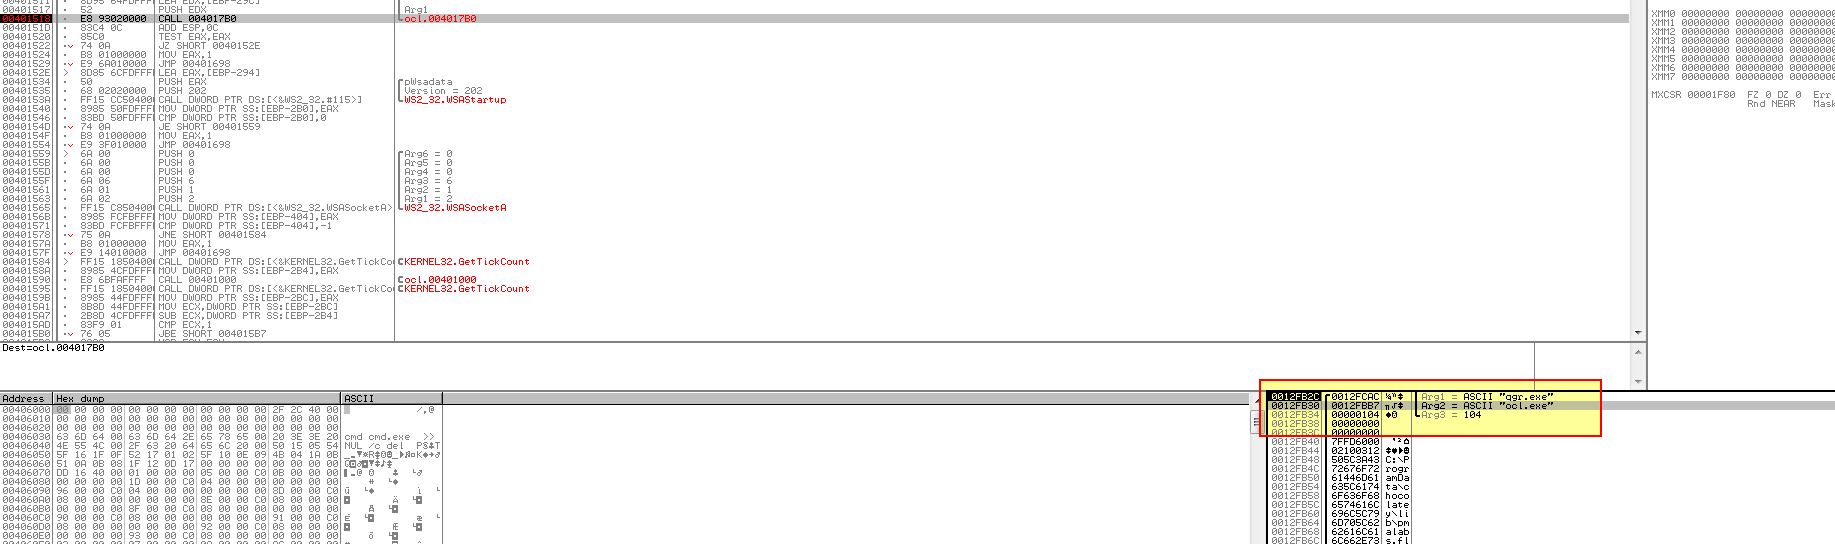
If we examine the main method of this malware using IDA Pro, we can see a familiar string being pushed to the stack ‘ocl.exe’.
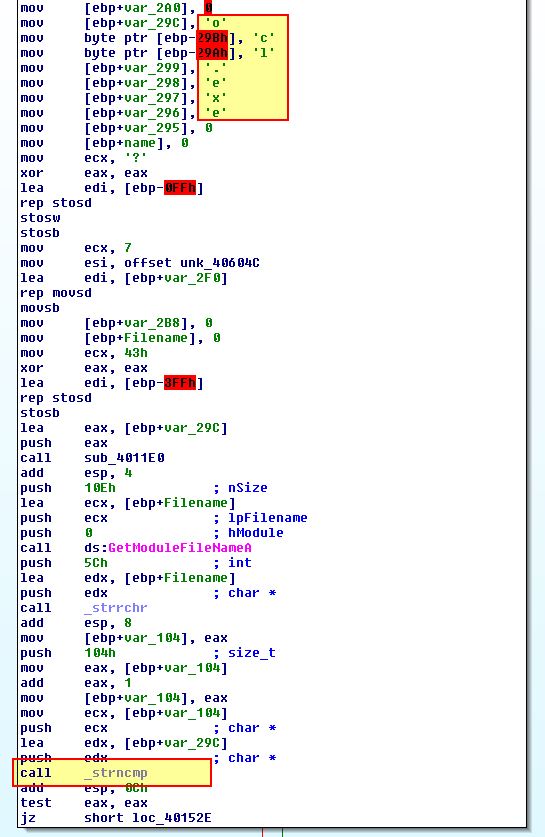
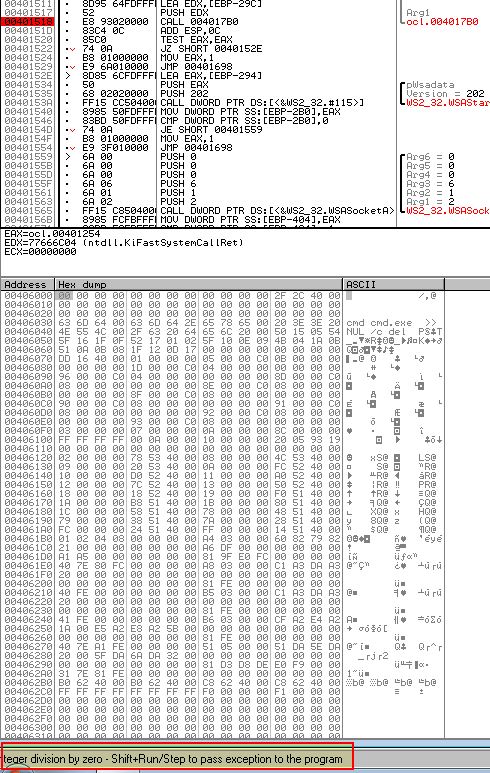
This was found back in Lab09-02.exe in question 3, which leads us to believe this is a copy of Lab09-02.exe which has been modified with anti-debugging techniques implemented. What we find if we rename this to ‘ocl.exe’ and attempt to run it is that nothing happens, so we need to examine the operations before the strncmp to see if any modifications are made to ‘ocl.exe’ prior to checking the binary module name. An easy way to do this is through a debugger setting a breakpoint at strncmp (0x401518); however, upon doing this and running the program, we can see we’re presented with a division by 0 error.
Using SHIFT + F9 we can pass this error back into the application we can see our break point is now comparing the string to ‘qgr.exe’.
Even if we rename the binary to this and continue to step through or run the binary again, we will soon hit another divide by 0 error, one we can’t successfully pass back to the program, and if we run Fakenet-NG we don’t see any network connections which we’re assuming this will make based on the API calls we identified.
To determine what is going on we will look at ‘sub_4011E0’ in more depth which is being passed the value ‘[ebp+var_29C]’ (ocl.exe).
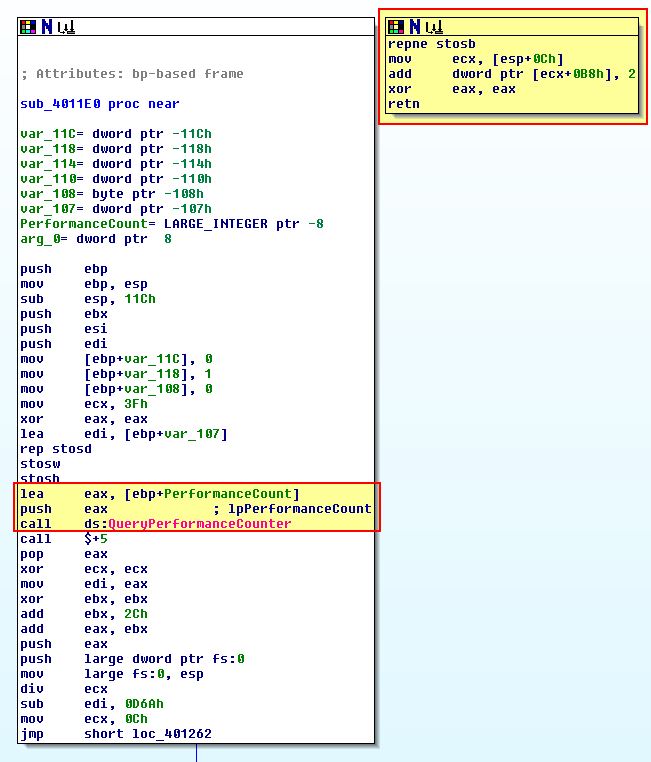
What’s immediately obvious in the above is that there’s a section of code which doesn’t look to be legitimately called anywhere given no cross-references have been inferred by IDA. This leads us to believe that only an abnormal condition will cause this code to be run, and when we compare this to a call to ‘QueryPerformanceCounter’, we can begin to infer that perhaps a timing check used for anti-debugging is in play so we will investigate how this works further.
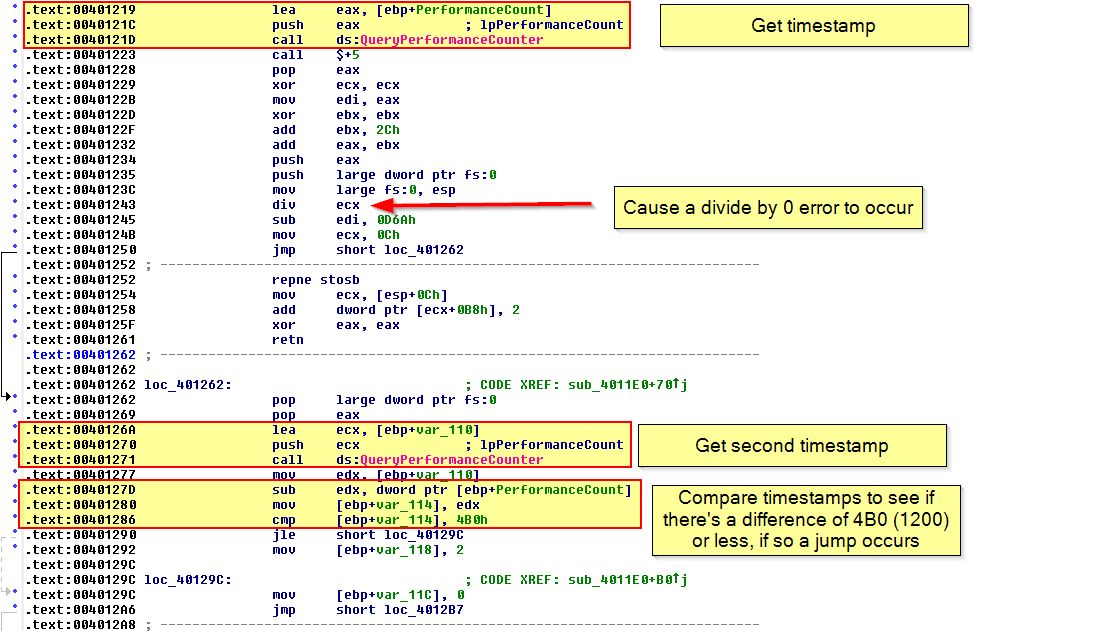
Firstly the program gets ‘[ebp+PerformanceCount]’ which contains the first output of QueryPerformanceCounter, then it will perform another check using QueryPerformanceCounter and store this in ‘[ebp+var_110]’. Now that it has two time-interval measurements, it subtracts these from one another, and then checks whether or not the result is less than 1200, and where it is a jump will occur. The overall process looks like the below, noting that whilst this is happening a divide by 0 exception looks to be thrown.
If we examine the rest of the function we find that if a jump successfully occurs (it passes this debugging check), var_118 will remain intact and is passed to what looks like a decoding or transformation routine, otherwise the value changes to ‘2’ which in essence will change the output of our decoding routine, and as such the program name which is checked by this executable.
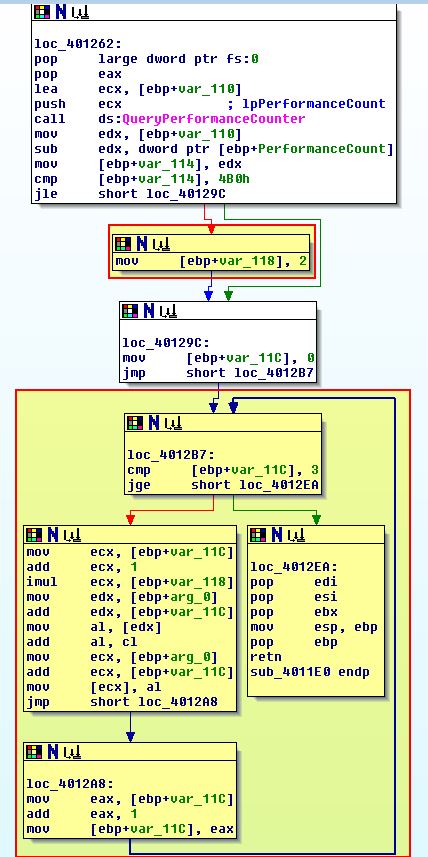
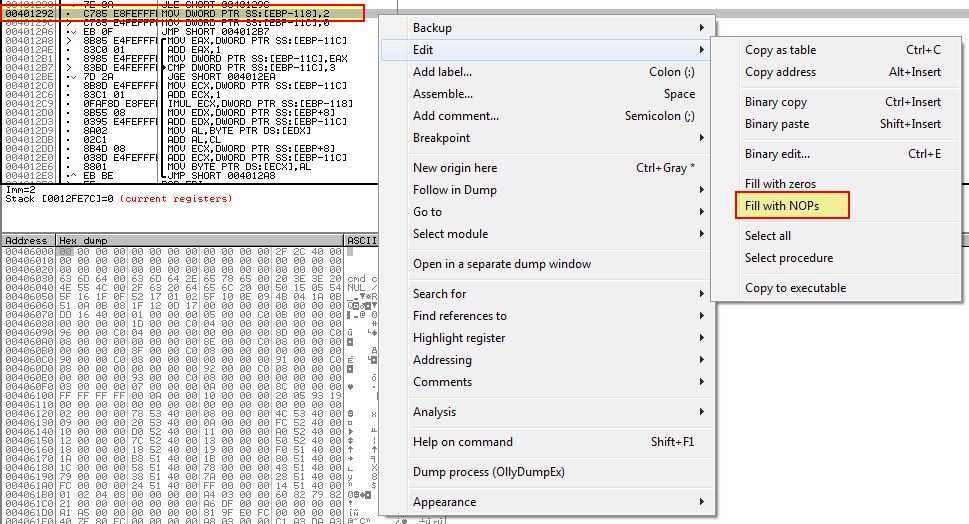
To ensure this check is passed, we can NOP out the instruction at ‘0x401292’ that changes var_118 to a ‘2’, or modify the JLE (7E) to instead be JG (7F).
By once again running the program and passing the error to the program when it occurs, we can see that a comparison is now made against the string ‘peo.exe’
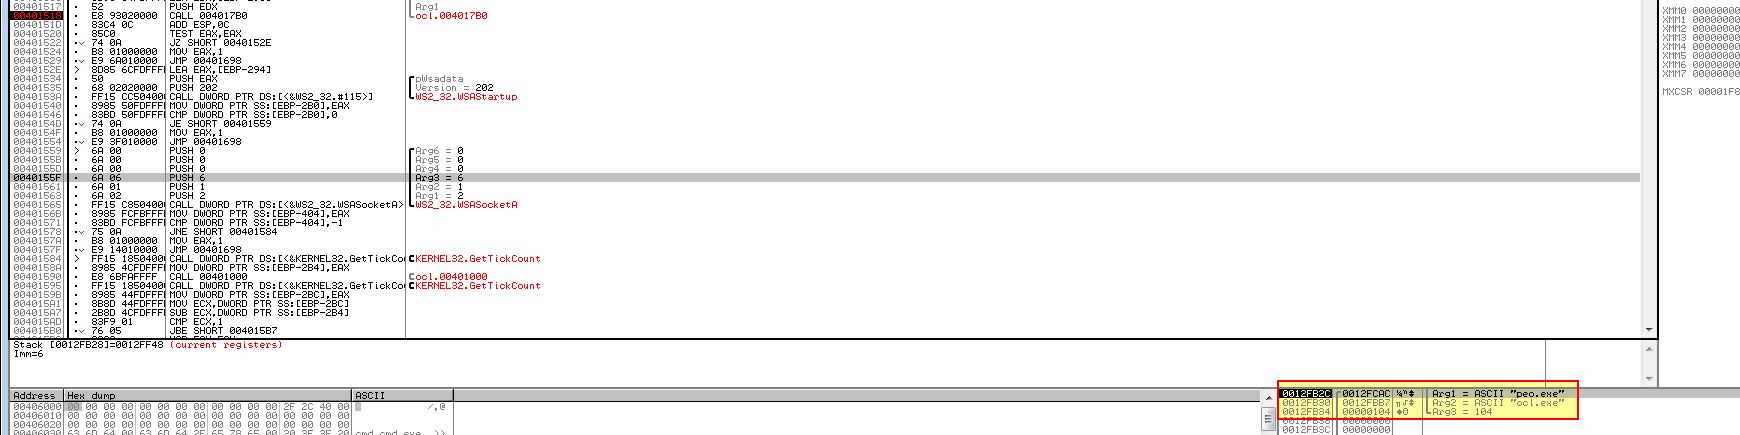
By running Fakenet-NG, renaming this binary to ‘peo.exe’, and running it we quickly see a large amount of text sprawling in Fakenet-NG indicating that a connection has gone out.
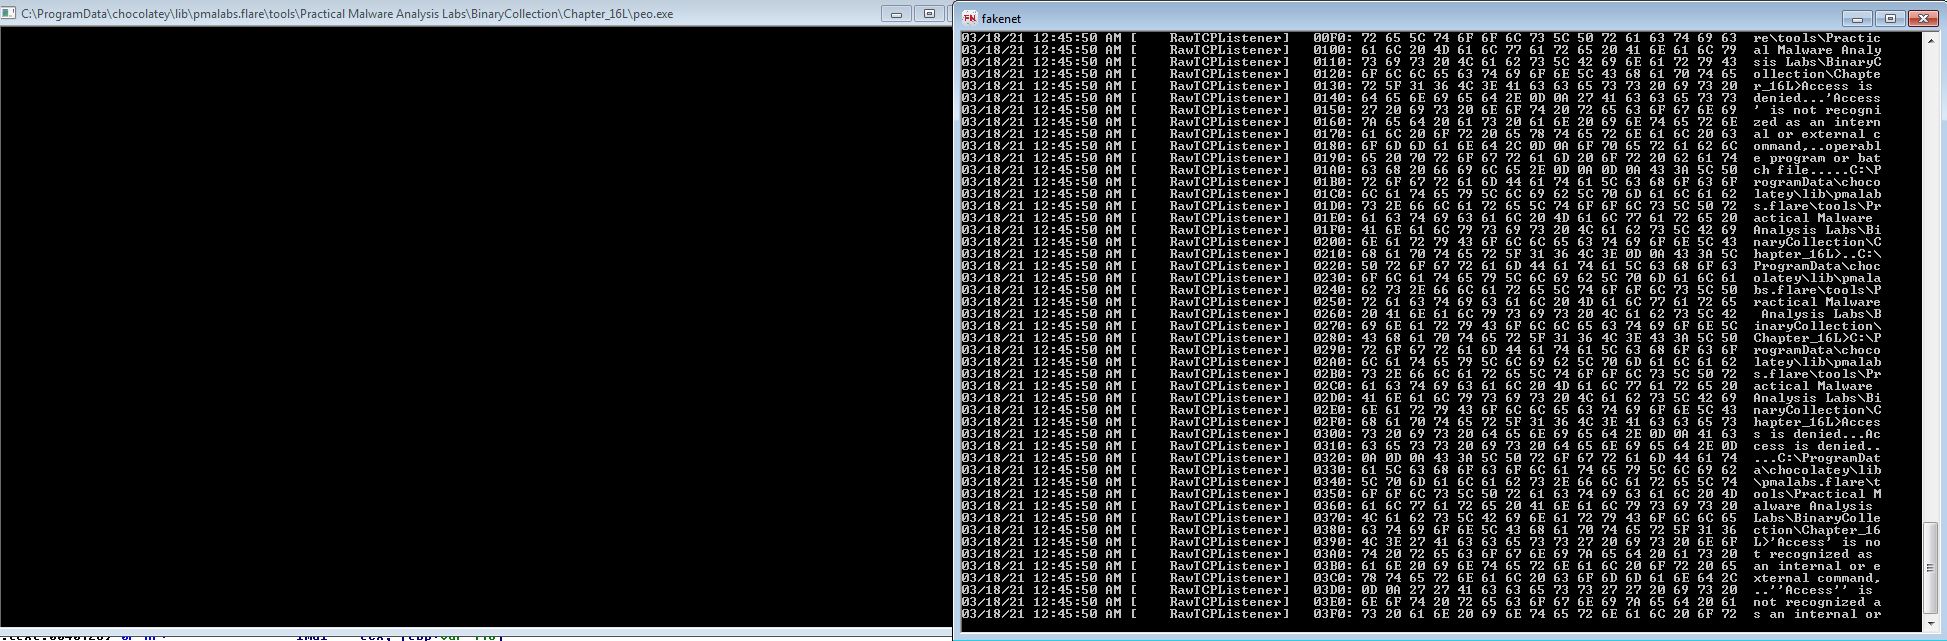
With this we know that the sample must be called ‘peo.exe’ for it to run properly.
Question 4
Which anti-debugging techniques does this malware employ?
Answer 4
From the above we know that this malware uses at the bare minimum timing checks using the ‘QueryPerformanceCounter’ API. To see if any more anti-debugging techniques are present, we can follow back on the main method before this makes an outbound connection.
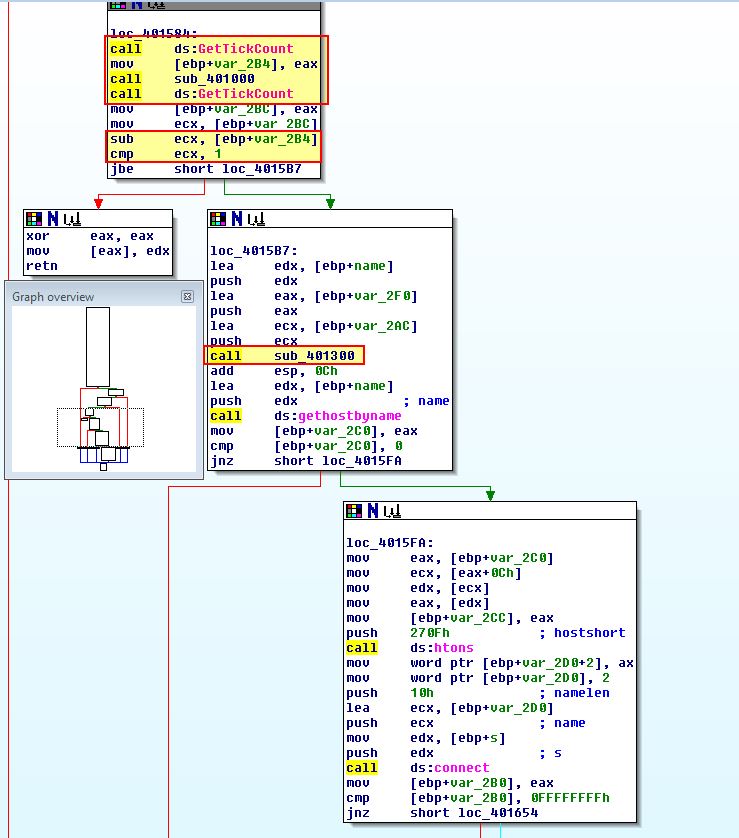
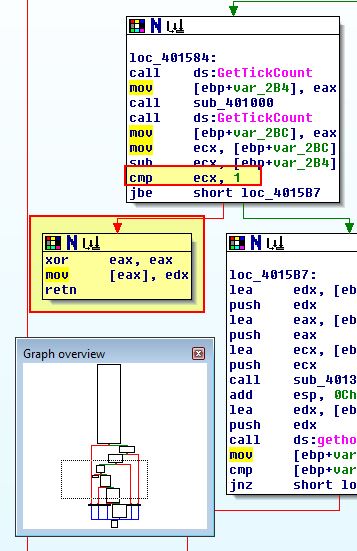
What we can see above is that 2 calls to sub-functions are made under ‘sub_401000’ and ‘sub_401300’ prior to API calls that lookup a domain name and make a connection indicating these may be used in anti-debugging checks, so we’ll look at ‘sub_401000’ first, particularly as this is surrounded by suspicious ‘GetTickCount’ API calls which looks to be another timing check.
What we see from the above is that this performs a similar divide by 0 to the last anti-debugging check we encountered; however, what we didn’t look into before is how both of these checks first use EIP (the current instruction pointer) with an offset of ‘2C’ to reference different code to execute. It will then push this as the location for a structured exception handler which will be called when the divide by 0 executes.
Both of these are designed to cause an exception which will cause latency during debugging execution, and as such cause a different outcome to occur from the malware. In this instance the ‘GetTickCount’ is just looking for a difference of ‘1’ (millisecond), at which point it will attempt to move ‘edx’ into a location pointing to ‘0’, leading to an access exception violation that makes the program crash.
If we now look at ‘sub_401300’ we can see what appears to be a similar comparison to what we saw in question 3, only instead of ‘QueryPerformanceCounter’ being used, it is instead using ‘rdtsc’ to get 2 timestamps of interest, and then after subtracting them comparing the difference to ‘500000’. Where this is exceeded, ‘sub_4010E0’ will be called.
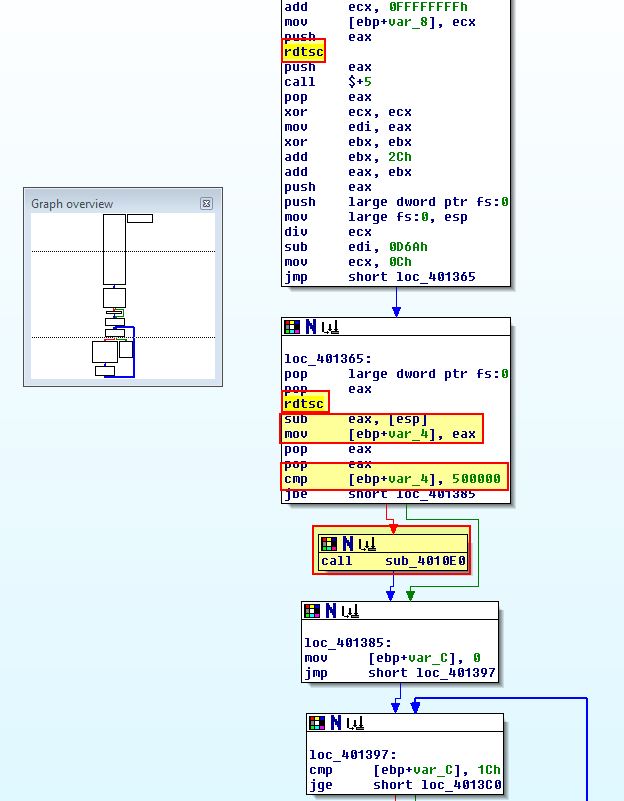
Examining ‘sub_4010E0’ we find that this is a deleting routine which attempts to delete the binary in question if this check fails.
Question 5
For each technique, what does the malware do if it determines it is running in a debugger?
Answer 5
QueryPerformanceCounter:
In question 3 we determined that the malware would modify a variable to be ‘2’ which would throw off its filename check if it detected it was being run in a debugger based on ‘QueryPerformanceCounter’ timing API checks.
GetTickCount:
In question 4 we determined that the malware would cause an access violation and crash if it detected it was running in a debugger based on ‘GetTickCount’ timing API checks.
rdtsc:
In question 4 we determined that the malware would attempt to delete and kill itself if it detected it was running in a debugger based on the ‘rdtsc’ assembly instruction to perform a timing check.
Question 6
Why are the anti-debugging techniques successful in this malware?
Answer 6
The anti-debugging techniques used are successful because there’s more than one used and they rely on timing differences which would only be present if the malware wasn’t able to handle errors thrown to its own structured exception handler. These timing differences become apparent when a debugger intercepts the divide by 0 errors, whereas if they ran outside of a debugger the latency generally wouldn’t be present.
Question 7
What domain name does this malware use?
Answer 7
From our analysis in question 4, we can NOP out the conditional jumps or the actions taken inside of these as required to ensure the malware runs as normal. Note: We can use CTRL+G to quickly navigate there through OllyDbg.
What’s easier is to instead now use dynamic analysis given we know the checks are only looking to identify the presence of a debugger and we now know the name this binary needs.
By running ApateDNS we can intercept the DNS request made when this malware is successfully run.
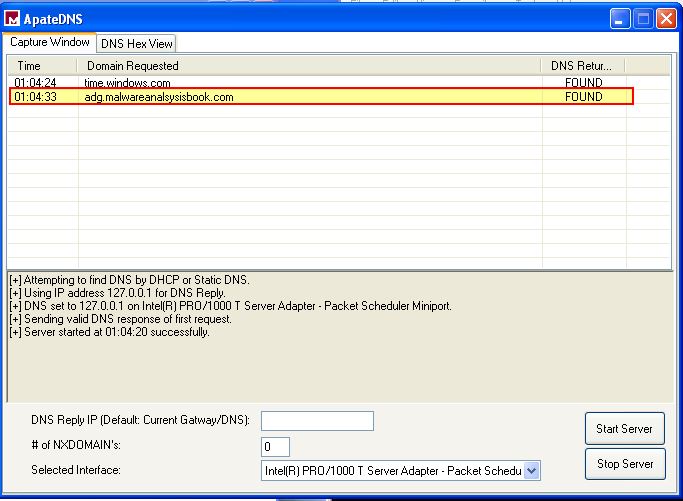
From this we know the domain name used by this malware is adg.malwareanalysisbook.com
This concludes chapter 16, proceed to the next chapter.